// reusable public data
Charts and data ready for direct citation.
Investigation figures and recurring l0g series, with downloadable data, methods and attribution guidance. Each package retains the dates, scope and limits needed for reuse.
// reuse contract
Credit, date and contextualise.
Name the series, link to its permanent l0g page and include the access date.
Keep the published observation date. Current values are not retroactive historical data.
Each 0-100 score has its own method. Equal readings are not economically equivalent.
// reusable investigation figures
Two investigations, from figures to sources
Each package contains an original standalone figure, calculation data, method and citation. These historical snapshots keep their observation dates; checking their sources does not make them current data.
Snapshot : · v1
CoreWeave’s conditional borrowing capacity
The initial and post-stabilisation borrowing ceilings in the DDTL 4.0 facility announced on 31 March 2026.

Calculation, scope and sources
DDTL 4.0, borrower CoreWeave Compute Acquisition Co. VIII, LLC. Announced borrowing capacities, in USD millions.
Calculation from published rounded amounts: 8,500 − 7,500 = approximately USD1,000 million of additional capacity. The two ceilings apply to different phases of one facility and must not be added together.
The announcement makes the increase conditional on asset stabilisation. The presentation describes lending at 90% of cost during installation, then a debt service coverage ratio of 1.2 times after customer acceptance, site by site. Both bars start at zero and use the same scale.
- CoreWeave, closing announcement filed with the SEC (2026-03-31). Paragraphs on initial capacity and asset stabilisation.
- CoreWeave, DDTL 4.0 presentation (2026-03). Pages 4 and 5: terms and debt sizing.
Sources checked on .
Olivier Laurelli / l0g.fr, “CoreWeave’s conditional borrowing capacity”, data dated 2026-03-31, sources checked 2026-10-23, v1. https://l0g.fr/en/press-resources/#coreweave-ddtl4-2026-03-31. Original figure and calculations : CC BY 4.0.
Read the investigation and its limits →Snapshot : · v1
Trafigura’s liquidity components
Available cash and undrawn committed facilities at 31 March 2026, with the contingent line kept inside its disclosed perimeter.

Calculation, scope and sources
Group liquidity as defined by Trafigura in its financial review, in USD millions.
Calculation: 7,700 + 11,700 = USD19,400 million, or USD19.4 billion. The chart segments use a proportional scale and together make up that total.
The USD3,000 million contingent facility is disclosed as included and undrawn. It sits within undrawn facilities: it is not added to either USD11,700 million or USD19,400 million. The CSV distinguishes components, subset and total; summing every row would double-count.
- Trafigura, 2026 half-year financial review (2026-06-04). Paragraphs on end-March liquidity and the contingent facility.
- Trafigura, Half Year Report 2026 (2026-06-04). Pages 4 and 5, Financial review. The same issuer disclosure.
Sources checked on .
Olivier Laurelli / l0g.fr, “Trafigura’s liquidity components”, data dated 2026-03-31, sources checked 2026-10-23, v1. https://l0g.fr/en/press-resources/#trafigura-liquidity-2026-03-31. Original figure and calculations : CC BY 4.0.
Read the investigation and its limits →Original l0g figure and calculations: CC BY 4.0. Credit l0g and the sources, retain dates and limits, and identify adaptations. Third-party publications and data retain their own rights; l0g grants no new licence over them. No market quotations or licensed price database are redistributed.
Documented investigations
These analyses connect primary documents, explanatory figures and explicit limits. Cite the investigation alongside the original evidence for any claim you reuse.
The collateral that cannot leave the building
A GPU-backed loan earned an investment-grade rating in March 2026. The security package shows the rating prices the customer, not the chip.
Reporting angle. Examine the equipment, customer contract and data centre lease behind GPU-backed lending, then distinguish contractual security from recoverable value.
Limits to retain. The borrower’s disclosures describe the facility. Full credit agreements, enforcement outcomes and comparable liquidation values are unavailable in the investigation; the analysis establishes no realised loss.
Figure, calculation data and method
- CoreWeave: March 2026 facility announcement filed with the SEC
- CoreWeave: DDTL 4.0 facility presentation, March 2026
Explore the documented financing map
Olivier Laurelli / l0g.fr, “The collateral that cannot leave the building”, 21 August 2026, https://l0g.fr/en/analysis/collateral-that-cannot-leave-the-building/, CC BY 4.0.
Greensill: lending before the invoice exists
Future receivables, insurance and frozen funds: Greensill explained, from the UBS exit offer to IAG’s confidential September 2026 settlement.
Reporting angle. How future receivables, insurance coverage and fund redemption terms interact when the underlying trade is uncertain.
Limits to retain. Keep the distinction between documented receivables, expected future business and disputed insurance coverage. Confidential settlement terms do not establish a public allocation of liability.
Explore the documented financing map
Olivier Laurelli / l0g.fr, “Greensill: lending before the invoice exists”, 28 September 2026, https://l0g.fr/en/analysis/greensill-insurance-future-receivables-risk/, CC BY 4.0.
Aon and Blackstone: who sets the price of risk?
Cortina would bring new capital to reinsurance. Who would select the risks, challenge prices and keep providing cover after losses?
Reporting angle. The underwriting decisions, pricing incentives and concentration risks behind follow-form reinsurance capital.
Limits to retain. The reported Cortina proposal excludes life and retrocession. Final approval and operating performance are not established by this investigation. Numerical examples illustrate mechanisms rather than forecast losses or savings.
Olivier Laurelli / l0g.fr, “Aon and Blackstone: who sets the price of risk?”, 29 September 2026, https://l0g.fr/en/analysis/aon-blackstone-cortina-reinsurance-risk-pricing/, CC BY 4.0.
The banks behind Trafigura’s oil trading
An investigation into Trafigura’s lenders, revolving credit, collateral and margin calls, and the limits of what public disclosures reveal.
Reporting angle. Separate a commodity trader’s committed credit facilities, actual borrowings, collateral and cash needed for margin calls.
Limits to retain. A lender’s name in a facility announcement does not reveal its drawn exposure. Facility commitments, balance-sheet debt and hypothetical stress examples must retain their separate definitions.
Figure, calculation data and method
Explore the documented financing map
Olivier Laurelli / l0g.fr, “The banks behind Trafigura’s oil trading”, 7 September 2026, https://l0g.fr/en/analysis/banking-on-oil-2-banks-financing-trafigura/, CC BY 4.0.
Attribute l0g’s original text and figures, link to the specific analysis and indicate changes. Third-party material and underlying sources retain their own rights. A citation must preserve dates, scope and uncertainty.
// recurring series
Chart, data, method and citation.
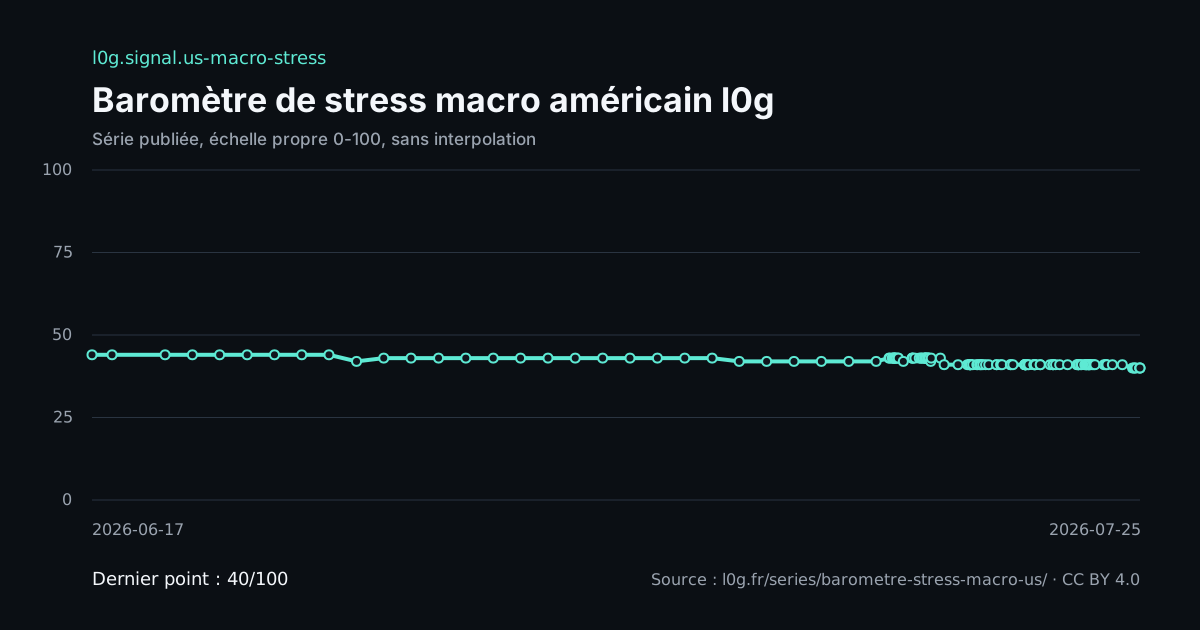
l0g.signal.us-macro-stress
Baromètre de stress macro américain l0g
Stress macroéconomique américain normalisé sur 0-100 à partir du signal publié par US Macro Dashboard.
Embed code
<figure>
  <img src="https://l0g.fr/api/v1/signals/barometre-stress-macro-us/chart.svg" alt="Baromètre de stress macro américain l0g" width="1200" height="630">
  <figcaption>Source: l0g.fr, Baromètre de stress macro américain l0g, CC BY 4.0.</figcaption>
</figure>
l0g.fr (2026), « Baromètre de stress macro américain l0g », l0g.signal.us-macro-stress, méthodologie 2.0.0, CC BY 4.0, https://l0g.fr/series/barometre-stress-macro-us/
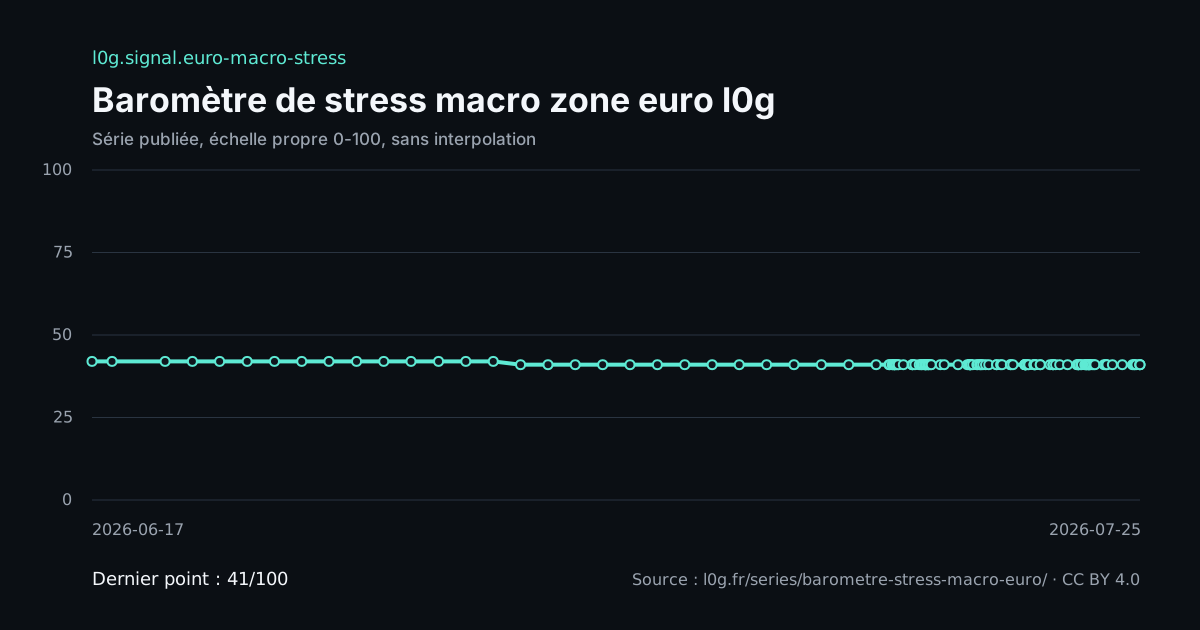
l0g.signal.euro-macro-stress
Baromètre de stress macro zone euro l0g
Stress macroéconomique de la zone euro normalisé sur 0-100 à partir du signal publié par EU Macro Dashboard.
Embed code
<figure>
  <img src="https://l0g.fr/api/v1/signals/barometre-stress-macro-euro/chart.svg" alt="Baromètre de stress macro zone euro l0g" width="1200" height="630">
  <figcaption>Source: l0g.fr, Baromètre de stress macro zone euro l0g, CC BY 4.0.</figcaption>
</figure>
l0g.fr (2026), « Baromètre de stress macro zone euro l0g », l0g.signal.euro-macro-stress, méthodologie 1.0.0, CC BY 4.0, https://l0g.fr/series/barometre-stress-macro-euro/
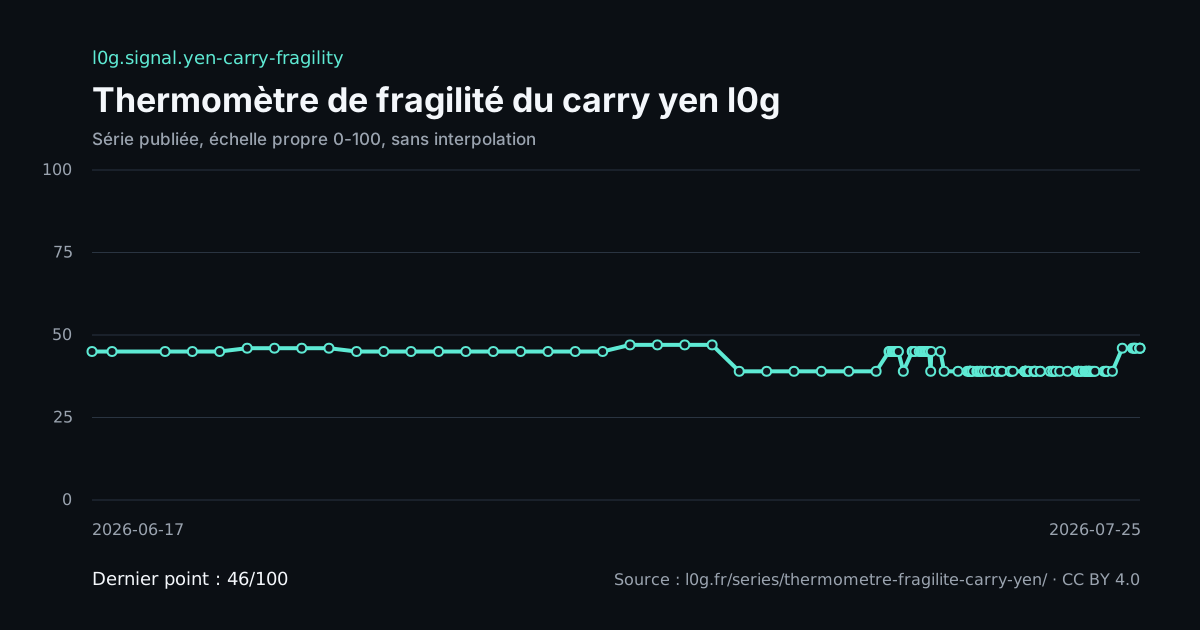
l0g.signal.yen-carry-fragility
Thermomètre de fragilité du carry yen l0g
Fragilité du carry trade financé en yen, normalisée sur 0-100 à partir du signal publié par Yen Carry Monitor.
Embed code
<figure>
  <img src="https://l0g.fr/api/v1/signals/thermometre-fragilite-carry-yen/chart.svg" alt="Thermomètre de fragilité du carry yen l0g" width="1200" height="630">
  <figcaption>Source: l0g.fr, Thermomètre de fragilité du carry yen l0g, CC BY 4.0.</figcaption>
</figure>
l0g.fr (2026), « Thermomètre de fragilité du carry yen l0g », l0g.signal.yen-carry-fragility, méthodologie 1.0.0, CC BY 4.0, https://l0g.fr/series/thermometre-fragilite-carry-yen/
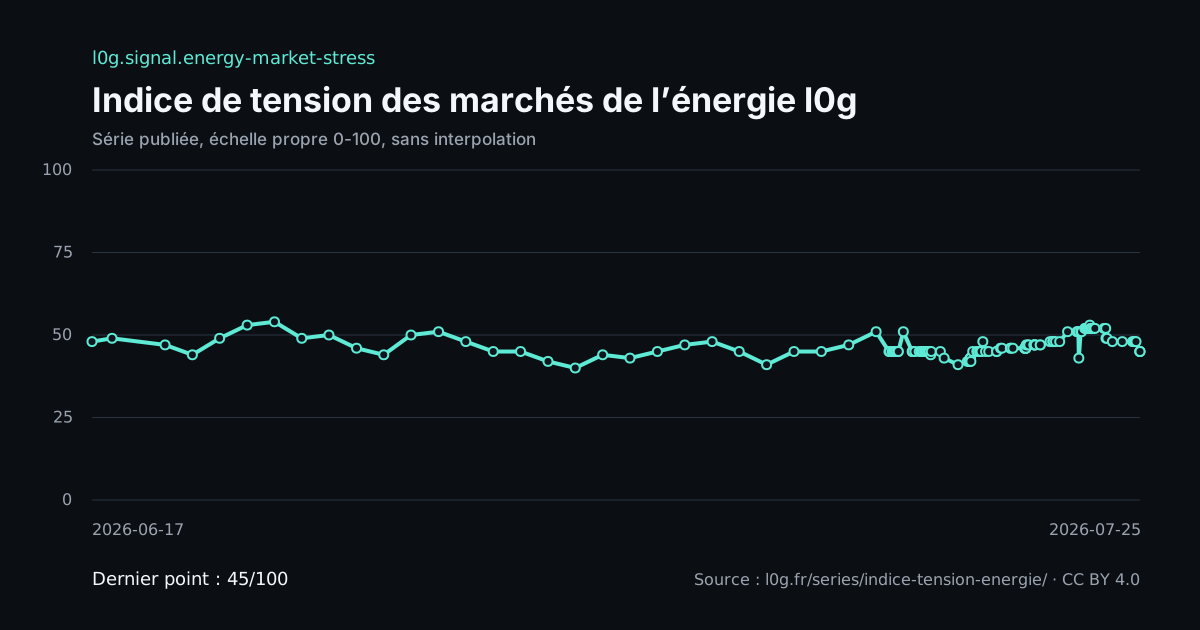
l0g.signal.energy-market-stress
Indice de tension des marchés de l’énergie l0g
Tension relative des marchés de l’énergie, normalisée sur 0-100 à partir du signal publié par Energie Monitor.
Embed code
<figure>
  <img src="https://l0g.fr/api/v1/signals/indice-tension-energie/chart.svg" alt="Indice de tension des marchés de l’énergie l0g" width="1200" height="630">
  <figcaption>Source: l0g.fr, Indice de tension des marchés de l’énergie l0g, CC BY 4.0.</figcaption>
</figure>
l0g.fr (2026), « Indice de tension des marchés de l’énergie l0g », l0g.signal.energy-market-stress, méthodologie 1.0.0, CC BY 4.0, https://l0g.fr/series/indice-tension-energie/
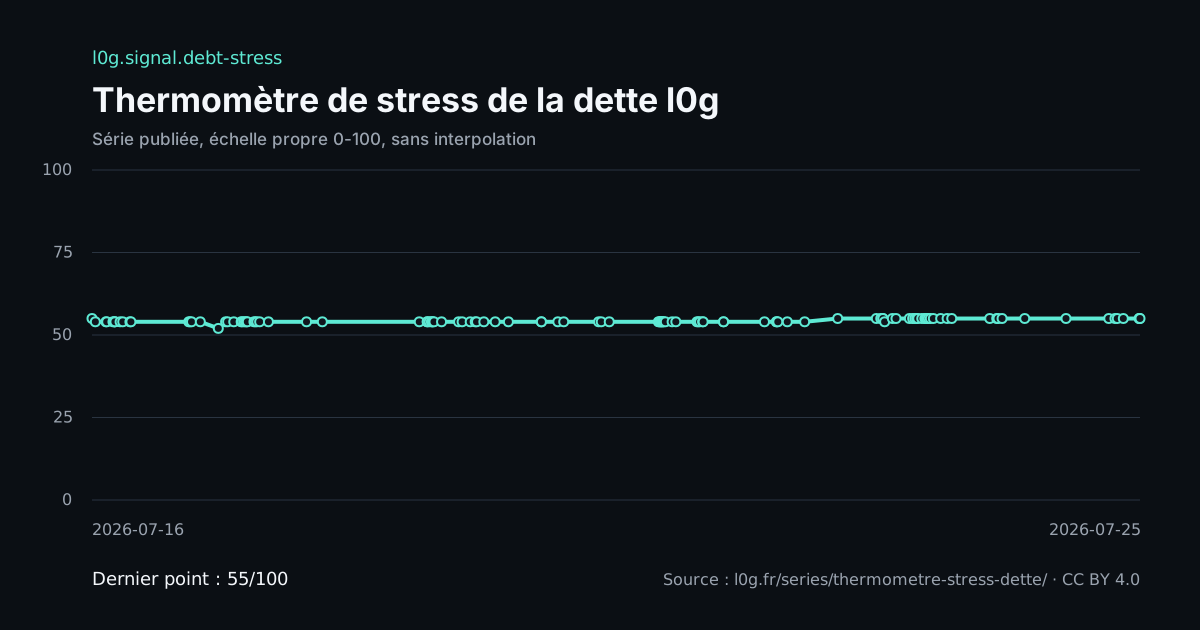
l0g.signal.debt-stress
Thermomètre de stress de la dette l0g
Stress courant de la dette publique et privée normalisé sur 0-100 à partir du signal publié par Debt Risk Radar.
Embed code
<figure>
  <img src="https://l0g.fr/api/v1/signals/thermometre-stress-dette/chart.svg" alt="Thermomètre de stress de la dette l0g" width="1200" height="630">
  <figcaption>Source: l0g.fr, Thermomètre de stress de la dette l0g, CC BY 4.0.</figcaption>
</figure>
l0g.fr (2026), « Thermomètre de stress de la dette l0g », l0g.signal.debt-stress, méthodologie 2.0, CC BY 4.0, https://l0g.fr/series/thermometre-stress-dette/
// included
A complete citation package.
- stable, indexable series pages;
- standalone SVG charts with embedded source and licence;
- CSV, JSON and NDJSON downloads without registration;
- versioned methods and an editorial changelog;
- separate publication, source and computation dates.
// boundaries
The limits of the published data.
- no real time when the upstream source is delayed;
- no invented continuity between observations;
- no global index comparable across instruments;
- no investment advice or certain forecast;
- upstream sources retain their own reuse terms.
// editorial requests
Need a format, method check or documented angle?
Open a public repository issue or contact Bluetouff through an official profile. A request does not imply exclusivity, a fixed delivery date or a predetermined conclusion.