// analysis
AI’s memory rush reaches the PC aisle
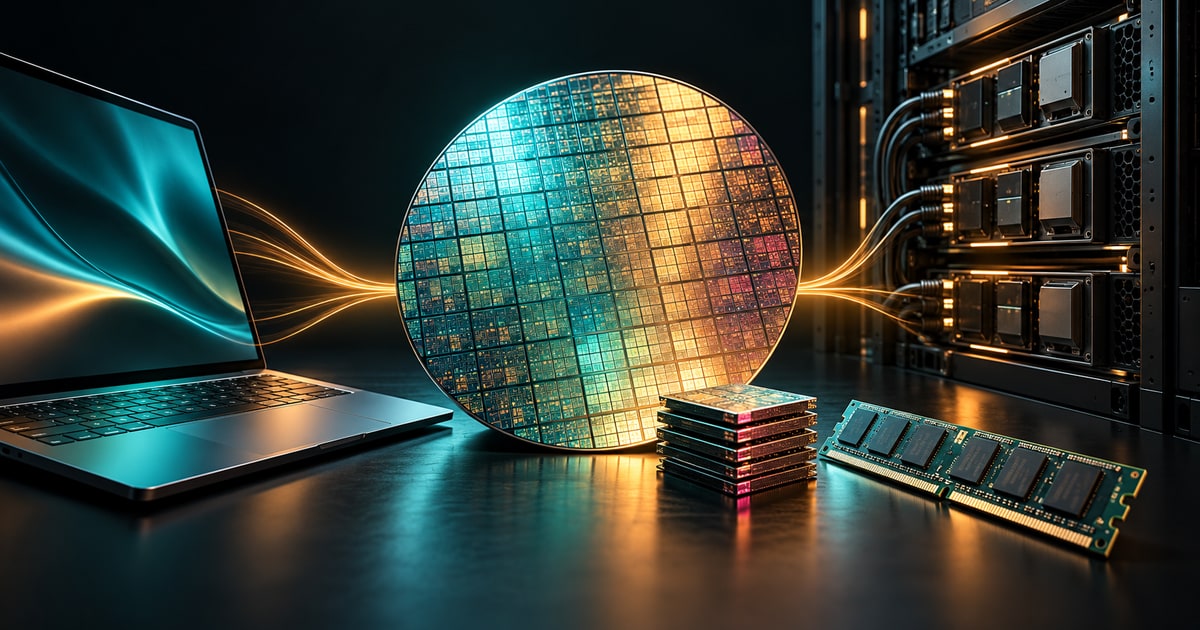
Working memory, storage and PC prices: French inflation data and disclosures from Micron, HP and Dell show how AI demand changes manufacturing choices.
Sources and reading context
Contents10 sections
A computer bought for homework, email and a family photo collection can share an industrial problem with the machines running artificial intelligence. Both depend on memory. Somewhere between the factories making those chips and the shop selling the laptop, the demand from data centres can reach an ordinary household’s budget.
France offers a useful place to follow that connection. In September 2026, the official price index for computers, laptops and tablets was 6.2% higher than a year earlier. Yet it was only 0.5% above September 2024. The rise followed a decline, and keeping both comparisons in view changes the story. R01
Insee, France’s national statistics office, links the increase in computer prices during the first half of 2026 to component supply tensions associated with the development of AI. Suppliers’ disclosures and computer makers’ accounts help explain how that pressure travels. They describe production being redirected, capacity promised in advance and selling prices adjusted to meet higher costs. The evidence establishes a route from AI investment to consumer computers. Calculating how much of a particular receipt belongs to that route requires more information. R02 R05 R12
The French curve has a dip
A percentage change depends on where the comparison starts. September 2025 was a low point in the French series. Measuring from there makes the subsequent rebound look steep; adding another year shows the ground on either side. The chart retains all 33 monthly observations from January 2024 to September 2026. R01
Method and scope
Insee monthly series 011816928: computers, laptops and tablets, all households, France. Average 2025 = 100; constant-quality price measurement. All 33 raw monthly observations, January 2024–September 2026; no smoothing or additional seasonal adjustment. Vertical axis spans 94–110, with explicit tick marks. Change = (final index / initial index − 1) × 100. September indices: 101.90 in 2024, 96.41 in 2025, 102.38 in 2026. Series updated 15 October 2026, retrieved 30 October. The curve does not apportion the causes of the change.
This is a price index, with the average for 2025 set to 100. September 2026’s reading of 102.38 is a position on that relative scale. The category also includes tablets, a detail worth remembering when comparing the series with news about the PC industry. R01 R16 R17
Insee aims to track prices at comparable quality. That matters for products whose specifications change frequently. A new version of a laptop may have more memory, a different screen or a larger drive. A buyer can pay more and receive more equipment at the same time. The statistical task is to distinguish the value of those changes from the movement in price, using methods suited to the products being followed. R03
This can create a gap between the household’s experience and the inflation measure without either being wrong. A family has a cash budget. If the cheapest suitable replacement offers better specifications at a higher price, the family still needs the extra money. An index asks a different question about the price of comparable goods. A maker’s average selling price, or ASP answers yet another question about the mix of machines actually sold.
The time window matters too. The average index for January–September 2026 was 2.1% higher than for the same nine months of 2025. September’s year-on-year increase was 6.2%, while the index fell 1.3% between August and September 2026. These calculations use the published monthly observations, with no seasonal adjustment applied here. A persistent industrial constraint can coexist with short-term movement in shop prices. R01
Two jobs hidden inside the word memory
Start with a file. While a computer is working on it, the processor needs quick access to the relevant data. Working memory provides that space. In an ordinary PC, this is generally DRAM, or dynamic random-access memory, a form of memory that loses its contents when power disappears. The file also needs somewhere to remain after the machine is switched off. In a solid-state drive, or SSD, NAND flash provides that persistent storage. R15 R18
The distinction is familiar once translated into everyday tasks. Working memory is the space available for what the machine is doing now. Storage is the place where documents, photographs and applications are kept. Increasing one solves different problems from increasing the other. Both can appear under “memory” in discussions of the semiconductor market, which makes the industrial story easy to muddle.
Many AI accelerators use a specialised form of DRAM called high-bandwidth memory, or HBM. Its stacked chips and many connections move large amounts of data to and from the processor. Bandwidth describes how quickly data can move; capacity describes how much can be held. HBM and the DDR memory used in PCs belong to the DRAM family, while taking very different forms inside a machine. R14 R18
The competition emerges earlier, in manufacturing. Chips begin on silicon discs called wafers. In June 2024, Micron gave a revealing estimate: producing a given number of bits in HBM3E consumed approximately three times the wafer supply needed for DDR5, using the same technology node. The comparison specifies a generation of memory, an equal quantity of bits and a common manufacturing generation. R04
Method and scope
Source: Micron prepared remarks, 26 June 2024, p. 6. Each drawn disc represents one relative unit of wafer resources; three discs express the approximate 3:1 ratio. Product drawings are schematic and imply no number of modules produced per wafer. This is the manufacturer's estimate for HBM3E versus DDR5. It does not apply to NAND, selling prices or power consumption.
Those conditions give the figure its meaning. With a limited pool of production resources, supplying more HBM can leave less scope for other DRAM products. The finished products have different forms and connections; their industrial relationship lies in the resources and choices upstream. The three-to-one estimate describes wafer requirements; converting that into a retail price would require further information about manufacturing yields, assembly, contracts and demand.
Storage follows a separate branch. NAND has its own production processes and markets. Data centres need SSDs as well as working memory, so they can exert pressure on that branch too. SK hynix’s October results described growth across HBM, server DDR5 and enterprise SSDs. Several kinds of memory and storage are being pulled towards data centres, each through its own industrial decisions. The HBM3E–DDR5 wafer comparison applies to its stated pair. R10 R15
Capacity has customers before the chips arrive
The allocation decisions appear in company accounts. For its fiscal year ended 3 September 2026, Micron reports that quantities shipped by its Mobile and Client business, measured in bits, declined as supply was redirected to other business units. That is a specific change in where output went, giving substance to the broader claim that AI demand competes with other uses. R05
Crucial makes the decision more recognisable to anyone who has upgraded a computer. On 3 December 2025, Micron announced that it would leave the Crucial consumer business, with consumer shipments scheduled through the end of its fiscal second quarter, in February 2026. Management cited demand from data centres and its intention to serve larger strategic customers. It also announced continued warranty service and support. The annual report makes clear that Micron still supplies components to third-party module and SSD makers. A familiar consumer brand can disappear while its parent’s chips keep reaching consumers through other companies. R08 R05
The timing of a purchase also runs much further ahead than the order on a retailer’s website. In December 2025, Micron said it had completed price and volume agreements covering its entire calendar-2026 HBM supply. At that point, these were commitments for future supply. A PC maker negotiating months later faces an industry whose production plans already carry promises to other customers. R06
Samsung’s results, published on 29 October 2026, describe a similar emphasis on AI-related products under capacity constraints. The accounts point in the same direction, although they come from suppliers with a commercial interest in presenting demand as durable. Their disclosures are most useful when placed beside independent price statistics and the accounts of the companies buying the components. R09
This is also why securing a quantity and securing a price are separate achievements. Dell describes long-term supplier arrangements under which some future prices remain subject to negotiation. A computer maker can gain confidence that it will receive components while retaining uncertainty about what it will pay for them. R12
Factories follow a slower calendar
New capacity needs buildings, equipment, production qualification and a gradual increase in output. On 30 September 2026, Micron’s timetable envisaged first wafers from its ID1 plant in Idaho around mid-2027, output from new NAND capacity in Singapore in the second half of 2028, and first wafers from its initial New York fab in 2030. These were company targets, followed by further time to ramp production. R07
The delay explains how large investment announcements and tight supply can exist together. Money committed today changes future possibilities. It takes time to change the number of usable chips available for the next computer production run. Long-term purchasing agreements help bridge that gap, giving the supplier a basis for investment and the customer a claim on future output.
The economics can also change while those agreements are in force. In its September presentation, Micron said higher HBM prices agreed for 2027 would narrow the margin gap with conventional DRAM. It also reported that a greater HBM share had weighed on one division’s margin in the quarter just ended. The immediate profitability ranking can therefore differ from the strategic importance of a product. R07
A factory’s future rests on existing commitments, customer relationships, production preparation and expected demand, alongside current margins. The financial incentive operates across several time horizons. That helps explain why a shift towards AI-related supply can persist through changes in relative profitability.
Prices themselves have different calendars. TrendForce’s public summary for specialty DRAM, dated 30 October, described spot prices retreating from their peaks while contract supply remained tight. This observation concerns the market covered by that report. It illustrates how immediate transactions and negotiated supply can move differently. Assessing PC memory as a whole requires evidence covering that broader market. R13
A component cost passes through several decisions
Between a wafer and a laptop sits a chain of businesses. Memory makers sell chips; other suppliers can turn those chips into modules or drives; computer makers obtain parts and assemble systems; distributors and retailers bring them to buyers. Some links are integrated or bypassed. The important point is that the price crosses several contracts before it becomes a household expense. Micron’s continuing component sales after its Crucial exit provide a concrete example of those intermediate routes. R05
Method and scope
Analytical diagram based on supplier and PC-maker disclosures. DRAM and NAND remain distinct manufacturing chains. Arrows show qualitative relationships; their width does not encode volumes. Pricing, specification and margin are possible responses whose combination varies by business. Some supply agreements secure quantities while leaving prices open to negotiation. Currency, taxes and competition add further influences.
At each stage, decisions change the timing and size of the effect. Inventory acquired earlier can delay exposure to a higher replacement cost. A supplier agreement can settle volume ahead of price. A manufacturer can accept a lower margin, raise the price of an unchanged machine, reduce a discount, alter the configuration or devote more of its range to expensive models. These are possible responses, whose actual importance has to be established company by company.
The component also enters a much larger bill. Depending on the machine, that bill includes a processor, screen, battery, casing and other parts, alongside assembly, distribution and commercial costs. The proportion exposed to a particular memory shock varies with the specification and the buyer’s purchasing terms. A percentage increase in the price of memory therefore acts on one part of the total cost.
Dell explicitly links memory cost inflation to strong AI demand and capacity limitations in its filing for the quarter ended 31 July 2026. It describes higher average selling prices and lower unit volumes in its Client Solutions business. This provides evidence from the receiving end of the component market: a computer maker reports the pressure and its commercial response. R12
Other influences remain in the picture. HP discusses currency movements and a Windows-based replacement cycle alongside commodity costs and product mix. A buyer in France also encounters the local tax basis, retailer competition and promotion calendar. The mechanism becomes convincing when evidence from different stages fits together. Its numerical precision remains limited by the information published at each stage. R11
The average-price trap
HP offers a particularly clear example. In the quarter ended 31 July 2026, its Personal Systems division reported an average selling price up 40.8% from a year earlier, PC unit volume down 15.8%, and revenue up 18.5%. These are worldwide business figures reported in dollars. HP attributes the average-price movement to pricing actions, currency and a shift towards higher-value products. R11
Method and scope
HP Form 10-Q signed 26 August 2026: Personal Systems, three months ended 31 July 2026 versus three months ended 31 July 2025. Worldwide business, revenue in current US dollars. Reported changes converted to indices, comparable 2025 period = 100. Multiplying rounded factors gives 1.185536; the chart retains the reported revenue increase of 18.5%. Portfolio ASP is not constant-specification inflation and cannot be compared directly with the French index.
An average can rise because comparable products become more expensive, because expensive products make up more of the sales, or through both changes together. Consider an imaginary shop selling a €600 computer and a €1,200 computer. Equal numbers of each produce an average of €900. If three-quarters of its sales shift to the €1,200 model, the average becomes €1,050 while both price tags stay unchanged. These figures are chosen solely to illustrate product mix.
The example explains why the 40.8% figure needs its accompanying explanation. It describes what happened to the average amount received per machine across a changing set of sales. Reading it as the price increase for an unchanged laptop would lose the mix effect. Comparing it directly with France’s 6.2% would also erase differences in geography, time period, product coverage and method.
Operating margins also followed different paths: HP’s Personal Systems margin fell year on year, while Dell’s Client Solutions margin rose. These worldwide business segments cover different activities and product mixes. Their accounts show that firms respond differently; isolating how much each passed on to buyers would require a more detailed cost comparison. R11 R12
Passing a component-cost increase into a PC price
An illustrative calculation makes the transmission easier to see. Imagine a computer selling for €1,000, with €150 of initial component costs exposed to a price shock. All amounts in this example exclude tax. Hold the other inputs fixed and suppose the affected cost doubles, adding €150. If 60% of that extra cost reaches the customer, the price increases by €90, to €1,090.
Method and scope
Teaching example with chosen assumptions: initial price P₀ = €1,000, exposed cost C₀ = €150, cost increase g = 100%, pass-through t = 60%. All amounts exclude tax; exchange rates, tax rates and other costs stay fixed. Price addition = C₀ × g × t = €90; absorbed cost = €60. Flow widths reflect the assumed 60/40 split. No parameter represents a market average or forecast. The formula is stated in the text; the calculator below lets readers change the assumptions.
l0g / COMPUTER PRICES / LOCAL CALCULATOR
Simulate the transmission of a component-cost increase
Fictional starting example: a €1,000 computer, €150 of exposed costs, a 100% increase in that cost and 60% passed on to the buyer. All amounts exclude tax.
Change the four assumptions
- Final price, excluding tax
- Additional cost
- Passed on to the buyer
- Absorbed along the sales chain
- Increase in the initial price
Calculation and scope
Final price = initial price + exposed initial cost × cost increase / 100 × share passed on / 100.
All four inputs are fictional assumptions. The model holds the configuration, exchange rate, tax rate and all other costs constant. It does not estimate memory’s market share, actual computer-price inflation or the contribution of AI.
Absorbed means the extra cost is not added to the buyer’s price. The model does not identify the company bearing it and does not calculate a profit margin. Inventories, contracts, promotions and timing remain outside this exercise.
Calculations retain their precision until display. Each amount is rounded independently to cents; displayed parts may differ by a cent when added.
Calculations run in this page. Inputs stay in memory while it is open.
Every input in that example is chosen for teaching purposes. The €150 is an assumed component cost, and the 60% is an assumed pass-through rate. The relationship is simple: extra selling price = initial affected cost × percentage cost increase × fraction passed through. A doubling is a 100% increase, so the middle factor equals one.
The calculation separates three questions often compressed into a headline. How much of the original cost is exposed? How sharply does that cost rise? How much of the increase reaches the final price? A large shock to a small component share can have a limited effect on the total. A more modest shock to a larger share, passed through fully, can matter more.
Putting real numbers into that relationship would require the manufacturer’s component purchase costs for the particular machine, the timing of replacement stock, the relevant cost changes and the commercial response. The public documents do not reveal that complete record model by model. The calculator below lets readers change the assumptions and inspect the result; it remains a scenario tool.
The same reasoning accommodates changes in configuration. A new generation can contain more memory, raising the bill even if the cost per unit of memory stays constant. A manufacturer can compress its margin. Weaker demand can prompt discounts. Those choices help determine the eventual price alongside the quantity of silicon under the keyboard.
Industrial choices and the household budget
Putting a precise AI surcharge on French computers would require a detailed cost and price history, together with a credible estimate of what prices would have done without the additional demand. The available documents reveal allocation decisions and commercial responses, while Insee tracks prices at comparable quality. The contribution of each cause remains unquantified. R01 R02 R05 R11 R12
The next readings of the same price series, changes in purchasing conditions and the actual ramp-up of announced capacity will add to that evidence. A spot quotation, a supplier’s average selling price and a household price index each describe a different part of the market. Keeping their units, dates and product boundaries attached is essential to reading them together.
For someone replacing a computer, a precise comparison starts with the work the machine must do, its configuration and the conditions of sale. For someone following the industry, it starts further upstream, with which customers have reserved capacity and which products the factories are preparing to make. AI demand connects those two perspectives. The price beside an ordinary laptop is one place where the decisions meet.
Further reading
Memory allocation sits within a wider set of physical constraints. TSMC checks the power supply planned for future data centres, while helium plays a role in chip manufacturing. These analyses examine other resources whose availability and schedules can change industrial decisions.
Sources and references
Documents accessed on 30 October 2026. French statistics, worldwide company accounts and fictional scenarios retain their units, periods and scope.
- IPC base 2025 ; Ensemble des ménages ; France ; 08.1.3.1 ; Ordinateurs y compris portables et tablettes (D)
The monthly index used for the French calculations at constant quality.
Passages and scope
January 2024–September 2026; annual 2025 average = 100
Idbank 011816928; monthly observations; OBS_QUAL=DEF
Measures neither an individual bill nor the causal contribution of AI.
- Pouvoir d’achat, inégalités de revenu et pauvreté ; Quelques questions
Connects pressures on electronic components with higher computer prices.
Passages and scope
First half of 2026 for the section on computer prices
Question 4; computer and electronic component prices
Provides no numerical decomposition of AI’s contribution.
- Shrinkflation, « effet qualité », évolution de l’offre de produits : comment l’Insee mesure-t-il le juste prix ?
Explains price comparisons at comparable product characteristics.
Passages and scope
CPI methodology; original publication in 2023
Introduction; tracking the same products and handling quality changes
Does not document each individual quality adjustment for computers in 2026.
- Fiscal Q3 2024 Earnings Call Prepared Remarks
Documents an approximately threefold wafer requirement for HBM3E.
Passages and scope
Statement of 26 June 2024; HBM3E and DDR5
Page 6, “Turning to supply”
Compares equal numbers of bits at the same technology node; does not compare prices or NAND.
- Micron Technology, Inc. ; Form 10-K FY2026
Documents average selling prices, volumes and supply reallocation.
Passages and scope
Fiscal year ended 3 September 2026: 53 weeks; FY2025 comparison: 52 weeks
Pages 10 and 56–57; risk of reallocating HBM capacity to conventional DRAM
Micron’s aggregates combine products and do not measure an unchanged computer.
- Fiscal Q1 2026 Earnings Call Prepared Remarks
Reaffirms the manufacturing ratio and the HBM supply commitments.
Passages and scope
Statement of 17 December 2025; HBM supply commitments for calendar 2026
Pages 1 and 5; HBM agreements, wafer ratio and cleanrooms
Contracted supply is not the same as deliveries already made.
- Fiscal Q4 2026 Earnings Call Prepared Remarks
Explains manufacturing lead times, contracts and relative margins.
Passages and scope
Fiscal Q4 and FY2026; capacity announcements for 2027–2030
Pages 2–4 and 7; production, contracts, NAND and HBM margins
Future starts and supply outlooks remain manufacturer announcements.
- Micron Announces Exit from Crucial Consumer Business
Documents the Crucial exit and management’s strategic explanation.
Passages and scope
Decision announced 3 December 2025; shipments planned through the end of fiscal Q2, in February 2026.
Paragraphs 1–3; Crucial business, transition and strategic rationale
Component sales to third-party manufacturers continue.
- Samsung Electronics Announces Third Quarter 2026 Results
Corroborates capacity constraints and prioritisation of AI-related products.
Passages and scope
Quarter ended 30 September 2026; outlook for Q4 2026 and 2027
“DS To Sustain Growth by Proactively Meeting Growing Demand for AI Applications”
The 2027 outlook is a company forecast.
- SK hynix Announces 3Q26 Financial Results
Describes server demand and multiyear capacity commitments.
Passages and scope
Q3 2026; capacity commitments for 2027–2028
Product sections and “Long-term agreements secured for more than 50% of 2027~2028 production capacity”
The aggregate denominator does not provide a precise breakdown by memory type.
- HP Inc. ; Form 10-Q, quarter ended July 31, 2026
Separates average prices, mix, currency, unit volumes and margins.
Passages and scope
Three months ended 31 July 2026, compared with the three months ended 31 July 2025
Page 45, Personal Systems; page 58, signature
The worldwide average selling price is not inflation for an unchanged PC.
- Dell Technologies Inc. ; Form 10-Q, quarter ended July 31, 2026
Documents cost transmission and pricing decisions.
Passages and scope
Q2 FY2027, ended 31 July 2026; comparative period ended 1 August 2025
Pages 47, 59 and 65; Client Solutions Group; purchase-agreement clause with prices to be agreed appears on p.65.
Worldwide scope and group contracts; no causal estimate for an individual computer in France.
- Specialty DRAM Price Oct. 2026
Distinguishes easing spot prices from tight contract supply.
Passages and scope
October 2026; contractual outlook for 2027
Indexed public summary and “Key Highlights”; full report not consulted
Partial access through the indexed public summary; the complete report and dataset were not consulted.
- HBM3E
Describes HBM stacking and its function beside accelerators.
Passages and scope
Product documentation consulted on 30 October 2026; HBM3E generation
HBM3E overview; 8-high and 12-high stacks; FAQ
Performance comparisons rely on the manufacturer’s methods.
- What is an SSD?
Distinguishes NAND storage, volatile memory and controller functions.
Passages and scope
Technical definitions consulted on 30 October 2026
“How do solid-state drives work?”; NAND, DRAM, controller and firmware
This technical explanation supplies no price measurement.
- Sous-classe 08.1.3.1 : Ordinateurs y compris portables et tablettes (D)
Defines the equipment covered by the statistical category.
Passages and scope
eCOICOP v2 classification documented on 20 July 2026
“Includes” and “Excludes” sections
The category includes tablets and excludes the explicitly listed categories.
- En janvier 2026, l’indice des prix fait peau neuve !
Explains the switch to base 2025 and eCOICOP v2.
Passages and scope
Rebasing applicable from the January 2026 indices
Introduction and the section on the new classification of consumption purposes
Rebasing alone does not change rates of change.
- DRAM | Memory | Samsung Semiconductor Global
Defines volatile memory and the DDR, LPDDR, GDDR and HBM families.
Passages and scope
Technical documentation consulted on 30 October 2026
FAQ: DRAM examples, function, volatility, and the relationship between DRAM and RAM
Manufacturer technical documentation, without price data.
This analysis is not investment advice.
// cite this analysis
l0g, “AI’s memory rush reaches the PC aisle”, l0g.fr, published October 30, 2026, updated October 30, 2026, https://l0g.fr/en/analysis/ai-memory-pc-prices/
$ cd ../analysis