// analysis
European gas: bridging the gap between cargoes
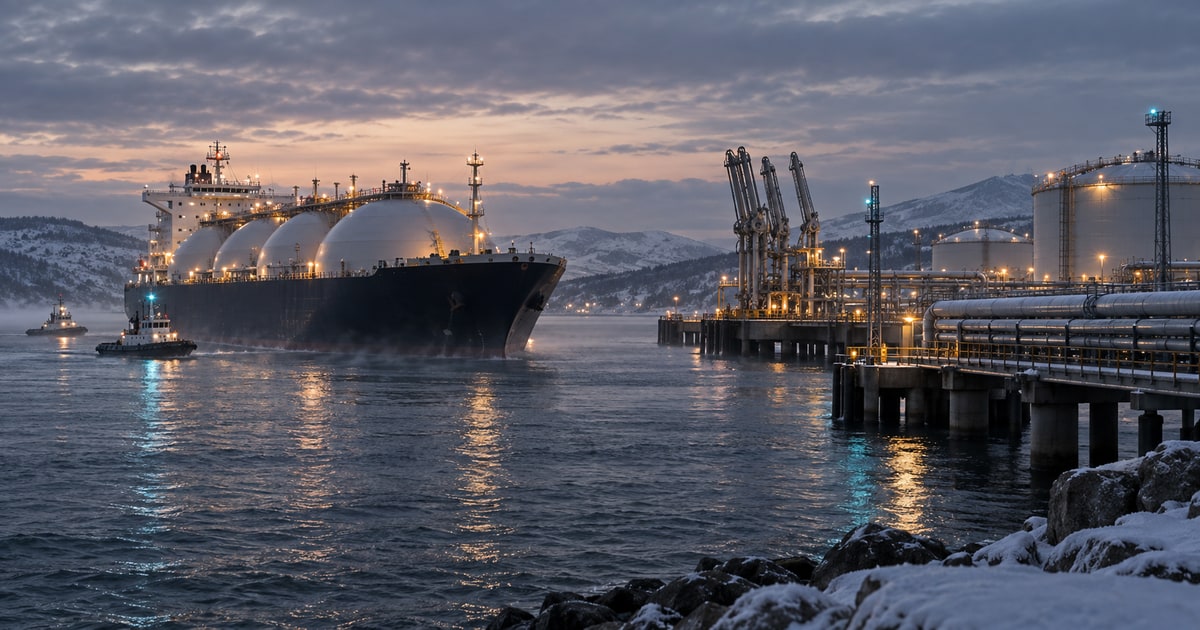
Lower storage levels, replacement cargoes and the 2027 refill season: ENTSOG scenarios assess Europe’s gas supply risks for winter 2026/27.
The contract runs for twenty-five years. The receiving terminal is already operating. Yet on 28 September 2026, Edison announced that QatarEnergy had extended the force majeure affecting some Italian gas deliveries until early December. Edison said it had replaced twenty-three cargoes by that date and could meet its commitments to customers. That assurance comes from the company; we have no independent audit of the deliveries. [1]
The episode captures Europe’s exposure. Supply can be contracted and import infrastructure available while replacement deliveries remain necessary for months. Security then depends on which alternative cargoes can be obtained and how much stored gas can bridge the gap. Liquefied natural gas, or LNG, arrives by ship, enters the terminal’s tanks and is returned to gaseous form before entering the network. Each stage has its own capacity and timing constraints. [1] [2]
The assessment released on 8 October by ENTSOG, the European network of gas transmission system operators, describes infrastructure able to accommodate substantial imports. It also identifies conditions under which available gas, or the ability to deliver it, falls short. Infrastructure creates options. Supply flows must make those options usable. [2]
Winter 2026/27 turns on availability at the right time. Lower inventories make continuing arrivals more important. Early withdrawals reduce flexibility for later cold spells. A depleted system in spring faces a harder refill season. Macroeconomic effects can begin as businesses adjust production to these constraints, well before any formal rationing decision.
Storage buys time
On 1 October 2026, underground gas storage in the European Union was 72% full, compared with 83% a year earlier. ENTSOG associates those levels with approximately 811 and 940 terawatt-hours. The gap is eleven percentage points, or about 129 TWh using the executive summary’s rounded volumes. These are start-of-month observations, not a reading taken on this article’s publication date. [2]
A terawatt-hour measures a quantity of energy. Withdrawal capacity measures how much can be delivered over a period, for example in gigawatt-hours per day. A substantial reserve that is slow to draw down offers less protection against a sharp peak than a store capable of high daily output. Inventory and deliverability answer different questions. [5]
Imports continue throughout the winter. ENTSOG estimates that storage supplied approximately 26% of EU gas consumption during winter 2025/26. Its functions include bridging the gap between comparatively steady incoming supply and highly variable consumption. Turning the stored volume into a countdown of “days of gas left” would discard both continuing flows and weather-sensitive demand. [2]
Method, data and scope
EU underground storage, ENTSOG p. 4. Two 1 October observations: 83% and about 940 TWh in 2025; 72% and 811 TWh in 2026. Executive-summary figures are rounded; Figure 9 gives 943 TWh for 2025. We retain the summary’s precision and label the 129 TWh gap approximate. Filling rates use working capacity at each date, which may change. No cushion gas is added. Lower flow diagram is unscaled.
The aggregate also conceals location. Gas may be stored far from the area where demand is rising, with limited transmission capacity between them. The report identifies particular vulnerabilities in some landlocked countries in Central, Eastern and South-Eastern Europe. A reserve becomes useful through the routes that connect it to consumers. [2]
The European Commission offers an important counterweight to the concern. Its 8 October assessment points to progress since 2021/22: more diversified supply, additional LNG receiving capacity and lower demand. Those changes improve the system’s options. The Commission nevertheless draws in part on ENTSOG’s work, so the two publications should not be counted as separate simulations confirming the same result. [4]
An available berth still needs a cargo
LNG expands replacement options. A buyer can seek another producing region rather than rely on a single pipeline route. That flexibility also brings international competition. An Asian importer that loses its usual delivery may seek the same replacement cargo as a European customer. [2] [6]
Our guide to the gas and LNG market explains the regional benchmarks and costs behind these choices.
ENTSOG puts Qatar’s share at approximately 8% of EU LNG imports in 2025. Relatively limited direct exposure at EU level can coexist with substantial sensitivity to the global market. The report identifies the Strait of Hormuz as a route for around one-fifth of worldwide LNG trade. Disruption there can redirect buyers towards suppliers already serving Europe. [2]
The supply mix has changed too. ACER, the EU agency for the cooperation of energy regulators, reports that the United States provided 58% of EU LNG imports in 2025. The denominator is LNG imports, not all European gas consumption. Geographic concentration warrants attention, although distinct firms, contracts and facilities should not automatically be treated as a single supplier. [6]
For the winter under review, ENTSOG describes around 1,600 TWh of regasification capacity across its European assessment. Assumed supply potential is lower: 1,001 TWh in the case called LNG Optimal, and 801 TWh under LNG Tight. These are scenario inputs. Tight reduces daily available supply potential by 20% relative to Optimal. The word “Optimal” assigns no probability to that case. [2]
Method, data and scope
Period: 1 October 2026 to 31 March 2027. Unit: TWh, energy over the season. Approximate European regasification capacity of 1,600 TWh; LNG Optimal and Tight potentials of 1,001 and 801 TWh, Table 4. Reference line: about 1,060 TWh required for Reference demand and 30% EU final storage, with Russian gas minimised. Modelled Europe includes the EU and neighbouring systems, including the UK and Ukraine. No comparison with EU-only annual imports. Capacity, potential and requirement are not observed volumes or utilisation rates.
This gap explains how an additional terminal can help while leaving other constraints in place. It provides another entry point and may relieve a congested route. Using it still requires exportable gas, a ship, an unloading slot and capacity downstream. Improving the whole chain can increase usable supply; expanding one link alone leaves the others to be secured.
Edison’s replacement programme illustrates the point, with a crucial timing qualification. The thirty-five cargoes affected by its 28 September force majeure announcement cover April through early December. The twenty-three replacements are a position as of 28 September. Subtracting them to declare a twelve-cargo shortfall on that day would combine future scheduled deliveries with replacements already completed. [1]
Four supply scenarios
A security-of-supply exercise specifies conditions and calculates what the network can support. ENTSOG’s Reference demand comes from transmission operators’ estimates. Its Cold Winter case uses high historical country-level demand revised by those operators. That case tests the system; it is not a weather prediction for the coming season. [2]
Consider the scenarios in which Russian pipeline imports are minimised. Some residual volumes remain available to the model. Separate tests remove those flows completely. With Reference demand, both LNG assumptions considered here allow demand to be met, but EU storage ends March at 29% under LNG Optimal and 13% under LNG Tight. [2]
Cold Winter changes the outcome. With Russian pipeline imports still minimised, the model produces a demand-response requirement or potentially uncovered demand equivalent to 7% of European demand in that scenario under LNG Optimal, rising to 12% under LNG Tight. “European” here includes the EU and several neighbours, among them the United Kingdom and Ukraine. The response percentages use that demand perimeter; the displayed storage percentages refer to the EU. [2]
Method, data and scope
ENTSOG Table 1: Reference and Cold Winter, LNG Optimal and Tight, Russian pipeline supply minimised. Strategic reserves, representing 11% of EU working capacity in the model, remain subject to the national constraints assumed; they differ from technical cushion gas. Response means demand that must adjust or could remain uncovered, not a shortage probability. Full Russian pipeline interruption is a different scenario family. No GDP-loss coefficient is applied.
The 11% of storage remaining in those cold cases needs careful interpretation. It corresponds to strategic reserves retained under the national restrictions represented in the model. This is working gas whose release is governed by specific rules. Authorities may have ways to authorise its use. The number therefore describes neither the disappearance of all gas nor a universal pressure threshold at every storage site. [2]
Cushion gas is a separate category. It normally remains in a reservoir to maintain operating conditions. Working gas, against which the inventory percentages are measured, is defined above that base. Strategic reserves concern conditions of release; cushion gas serves a physical operating function. [2] [5]
The 13% end-March result likewise belongs with the assumptions that produce it: Reference demand and constrained LNG. It is useful for risk monitoring. Presenting it as the central forecast would give a conditional test a certainty it does not possess.
A cold day tests delivery speed
Pressure, geology, surface facilities and compression determine the speed at which stored gas can be withdrawn. In general, deliverability declines as inventory is used. Salt caverns, depleted fields and aquifers have different profiles. ENTSOG uses injection and withdrawal curves supplied by operators and aggregated by area. A single linear rule would erase those differences. [2] [5]
One test makes the consequence visible: a Peak Day within the Cold Winter assumptions, with LNG Optimal and Russian pipeline imports interrupted. In South-Eastern Europe, demand response needs or potentially uncovered demand reach approximately 7% with an initial storage level of 50%, rising to 12% when the starting level is 35%. These starting stocks are test parameters, not levels predicted for a particular date. The results refer to regional demand during that one day. [2]
Method, data and scope
ENTSOG p. 7 and Figure 39, p. 42. Cold Winter, LNG Optimal, Russian supply disrupted, Peak Day. Tested starting stocks: 50% or 35%. Outcomes: response needs of about 7% or 12% of that day’s South-Eastern European demand. These differ from Figure 3’s seasonal results. The section is schematic: no geometry, pressure or quantity depicts a real site. EIA supports the general mechanisms.
The exercise shows why a filling percentage alone gives an incomplete account of resilience. Gas remains in storage, but withdrawal speed and available network routes can limit the service it provides at the most demanding moment. A continental total describes the reserve; daily deliverability and the network determine how well it covers a peak.
LNG terminal tanks also provide a buffer between ships. In its two-week cold-spell test, ENTSOG combines arriving supply with temporary use of tank inventories. During the second week, the model permits additional cargoes up to the assumed supply potential. This captures the tanks’ buffering role, without guaranteeing that commercial deliveries will appear within seven days. [2]
Electricity adds a further coordination problem. Gas-fired plants can be called on more heavily when other generators produce less, at a time when heating already requires substantial gas. ENTSO-E’s contribution to the report describes this interdependence. It also states that its updated critical-gas-volume calculation for winter 2026/27 was still being prepared when the report was published. Illustrations for the previous winter cannot substitute for that missing assessment. [2]
The distinction between a continental balance and local constraints also runs through our investigation of power-system models and actual facilities.
Lower consumption can describe very different economies
Demand may adjust to tighter supply before authorities arrange any cuts. Prices make some uses less attractive, businesses change processes or operating schedules, and households adjust consumption. ENTSOG explicitly discusses price-sensitive demand. Its numerical results identify a requirement for adjustment; they do not establish which consumers would respond or how. [2]
For the economy, the composition matters. Efficiency improvements can preserve the same service while using less gas. Switching fuels may sustain production while changing exposure and emissions. Shorter operating hours reduce output. An identical fall in gas consumption can therefore accompany very different paths for production, investment and employment.
The International Energy Agency’s 7 July 2026 release described global demand restrained by supply conditions and prices, with fuel switching in some markets. That assessment retains its July date. It documents adjustment mechanisms rather than providing an account of Europe’s autumn. [7]
French businesses’ starting position makes this distinction relevant. The Banque de France survey published on 12 October, describing September, reports that higher input costs were only partly passed through to selling prices, squeezing margins. Conditions remained uneven across industries. The survey does not isolate a gas-specific causal effect. It shows that some manufacturers were approaching winter with limited ability to pass costs on. [8]
Using oil as its case study, our analysis of companies’ energy bills follows that transmission through currencies, hedges and financing needs.
Macroeconomic risk then develops through successive decisions. A business that holds selling prices steady may first absorb the shock in its margin, then postpone equipment or reduce an order. A business that raises prices may lose customers or erode their purchasing power. Part of the supply shock turns into weaker demand. Piero Cipollone’s 6 May 2026 speech discusses these connections between energy, real income and activity. [9]
Monetary policy must assess persistence, transmission into other prices and income responses. Gas-market stress can raise inflation while weakening activity; its presence does not determine the next interest-rate decision. Economic resilience requires looking at output and incomes alongside the gas saved. [9]
March already shapes the following winter
A manageable winter can leave a difficult starting point for summer. Storage must refill while imports continue to meet ongoing consumption. Injection capacity sets a pace, and maintenance or limited supply can restrict opportunities to accelerate it. [2] [5]
ENTSOG first runs a twelve-month simulation, from 1 October 2026 to 30 September 2027. It starts with EU storage at 72%, retains Reference demand and minimises Russian pipeline imports. End-of-September filling reaches 90% under LNG Optimal, compared with 65% under LNG Tight. The entire year is optimised together: winter decisions already take account of the summer ahead. [2]
A separate exercise starts on 1 April 2027, with storage fixed at 13%. Under Reference summer demand and minimised Russian pipeline imports, filling reaches 80% by end-September with LNG Optimal, and 86% with the increased supply assumed in LNG High. This tests how far a summer starting with very low inventories can catch up. The two exercises have different horizons. Joining them into one path would create a result that the report never calculates. [2]
Method, data and scope
Figures 44 and 46, pp. 46–47. First, a twelve-month calculation: starts at 72% on 1 October 2026; ends September 2027 at 90% in Optimal or 65% in Tight. Second, a summer calculation: starting level fixed at 13% on 1 April 2027; ends September at 80% in Optimal or 86% in High. Both use Reference demand and minimise Russian supply. No monthly interpolation; arrows show relationships rather than measured time paths.
The lesson concerns the value of time preserved. Extra supply in winter can avoid a withdrawal, maintain deliverability for a later cold spell and reduce the amount that must be injected during summer. Those benefits materialise at different dates. Looking only at end-March storage would miss part of the service.
Public storage rules add their own constraint. The reform adopted in July 2025 retains an autumn target of 90%, within a window from 1 October to 1 December and with flexibility. That differs from the 30% end-March objective in several ENTSOG tests, which the model can fall below in order to meet demand. A regulatory target, a modelling objective and a conditional result perform different functions. [2] [10]
Is the market preparing for the same summer?
The report contains a financial observation that sheds light on this timetable. It reproduces seasonal Dutch TTF gas prices from S&P Global Platts as of 30 September 2026: €72.350/MWh for winter 2026/27, €53.405 for summer 2027, and €49.030 for winter 2027/28. These are prices for delivery in different future periods, observed on the same date. They are not the prices that will necessarily prevail during those seasons. [2]
For an operator considering buying summer 2027 gas, storing it and selling it for delivery the following winter, the gross difference is 49.030 − 53.405 = −€4.375/MWh. The sign is already negative before storage, financing or transport. At that observation date, this pair of prices does not reward the simple seasonal carry described here. Other contractual obligations or forms of value can still support storage. [2]
In the other direction, selling available gas for winter 2026/27 and buying replacement gas for the following summer offers a gross difference of €18.945/MWh. This is not a guaranteed profit: access to inventory, operating constraints and expenses all matter. It illustrates an incentive that may differ from the collective interest in preserving reserves for peaks. [2] [3]
Method, data and scope
ENTSOG Figure 11, p. 24. Upstream source named in the report: S&P Global Platts, not accessed directly. TTF seasonal delivery prices observed on 30 September 2026, nominal euros per MWh. l0g calculations: 72.350 − 53.405 = 18.945; 49.030 − 53.405 = −4.375. Summer-to-next-winter carry is sale minus purchase, reversing the summer-minus-winter difference in the original second table. Gross spreads before expenses; no trade recommendation or promised return. The model uses stylised costs, but not these observed spreads.
The key methodological statement sits beneath ENTSOG’s price table: these observed seasonal spreads are not implemented in the model’s optimisation. The model uses stylised costs to allocate supply and penalise unmet demand or inventory below its objectives. It assumes cooperation across countries and does not include actual commercial supply contracts. The calculation describes the network balance under its infrastructure and supply assumptions; market participants may choose another path. [2]
That boundary makes the assessment useful rather than irrelevant. The test locates physical vulnerabilities. Prices and contract terms help explain the incentives to use available solutions. Reading them together provides a more complete account of resilience.
The IEA’s 9 September 2026 report argues that physical reserves need support from commercial flexibility and cooperation. LNG cargo swaps can help redirect available supply during a disruption. Their usefulness still depends on infrastructure, rules and commercial incentives; they do not guarantee an additional delivery this winter. [12]
Watch the handovers
The evidence supports a conditional conclusion. Sufficient arrivals, contained demand, other energy sources’ availability and effective cooperation can preserve meaningful margins. The Commission emphasises these capabilities, and ENTSOG’s favourable scenarios make them visible. October’s storage level alone does not establish an impending Europe-wide crisis. [2] [4]
Monitoring needs to follow gas through the system: exportable volumes, cargoes actually unloaded, terminal send-out, storage withdrawals and routes towards constrained areas. Heavily used and underused terminals can coexist because of market conditions or network limitations. A European total therefore needs a regional reading. [2] [6]
Demand adjustments deserve the same scrutiny. Resilience is stronger when efficiency or sustainable substitution reduces gas needs than when balancing depends on industrial production being abandoned. The difference will not appear in a filling percentage. It must be examined in output, investment and orders. [7] [8]
Finally, spring inventories and the incentives to rebuild them belong in the same picture as winter weather. Gas security rests on the ability to replace one supply source with another, maintain delivery during peaks and preserve enough time to refill. The coming months will show which of those handovers work in practice.
Sources and method
Documentary research closed on 14 October 2026. Scenarios come from ENTSOG’s report released on 8 October; starting stocks were observed on 1 October; the reproduced seasonal prices are dated 30 September. l0g calculations use the published numbers and retain their rounding. Figures distinguish observations, assumptions and conditional outputs. No live market price, scenario probability or quantified GDP effect has been reconstructed.
The PDF and the tables and figures used were read and visually checked. The revised Annexes A and B dated 9 October and Annex D were downloaded. Their capacities, supply assumptions and demand-response outputs were checked against the report. We have not rerun PLEXOS, audited facilities or obtained contracts. ENTSOG brings together transmission operators; GIE represents infrastructure operators. Their institutional positions are retained, and repeated findings are not counted as independent confirmations. ACER’s official release and the full report’s executive summary, page 4, were checked. [11]
The opening artwork is an AI-generated conceptual illustration. It does not depict an identified terminal or vessel.
- Edison · Edison: QatarEnergy extends force majeure until the beginning of December 2026. Published 2026-09-28. Financial release, paragraphs 1–4. 35 cargoes affected from April to early December; 23 replaced by 28 September. Different periods. Supply continuity is Edison’s statement, not independently audited.
- ENTSOG · Winter Supply Outlook 2026/27 including Summer 2027 Overview, SO0072-26. Published 2026-10-08. Printed pages 4–10, 13, 18–24, 38–47, 52–59. Tables 1 and 4; Figures 11, 39, 44 and 46. Capacity and cooperation scenarios, without probabilities or commercial contracts. EU stocks; demand and LNG for the model’s European scope. Stylised costs are used; observed seasonal spreads are excluded from the optimisation.
- Gas Infrastructure Europe · Europe enters winter with historically low storage levels, reinforcing the need for LNG imports and storage flexibility. Published 2026-10-09. Press release, 9 October 2026. Infrastructure operators’ association. Repeats ENTSOG scenarios; not an additional independent confirmation of the model.
- Commission européenne / European Commission · EU gas system prepared for the winter despite lower storage levels. Published 2026-10-08. Gas Coordination Group account. Preparedness and flexibility, lower demand, diversification and expanded capacity since 2021/22. Draws in part on ENTSOG.
- US Energy Information Administration · The Basics of Underground Natural Gas Storage. Published 2015-11-16. Introduction and Storage Measures. Physical definitions: working gas, cushion gas, withdrawal and injection. No US storage coefficient is applied to European sites.
- ACER · EU LNG imports hit record high in 2025 – ACER warns of growing exposure to global market risks. Published 2026-05-13. Official release and full report, executive summary p. 4, annual 2025 data. The US supplied 58% of EU LNG imports. The denominator differs from total gas consumption. Full ACER report.
- Agence internationale de l’énergie / International Energy Agency · Global demand for natural gas expected to contract this year as tighter supply pushes up prices. Published 2026-07-07. Gas Market Report Q3-2026 release. July assessment and forecasts retain their vintage. Fuel switching and demand reduction under constrained supply; no invented October revision.
- Banque de France · Enquête mensuelle de conjoncture – Début octobre 2026. Published 2026-10-12. September conditions; survey from 27 September to 5 October, about 8,500 businesses or establishments. Input pressure, incomplete pass-through to selling prices and margins. Descriptive survey, not a gas-specific causal estimate.
- Banque centrale européenne / European Central Bank · The new energy shock: economic scenarios and policy implications. Published 2026-05-06. Analysis of the energy shock’s macroeconomic transmission. Real-income, demand and inflation mechanisms. No interest-rate forecast or update of spring projections.
- Conseil de l’Union européenne / Council of the EU · Gas storage: Council greenlights 2-year extension of reserves filling rules to safeguard winter supply. Published 2025-07-18. Account of the revised storage rules. 90% target within the October–December window, with flexibility. Distinct from the end-March modelling target. Regulation (EU) 2025/1733 of 18 July 2025. Adopted text, Article 1(2)(a)–(b) and Article 1(8): 1 October–1 December window, conditional deviations and filling provisions applicable through 31 December 2027. Published in the Official Journal on 10 September 2025; entered into force the next day.
- ENTSOG · Outlooks & Reviews. Official index: report published on 8 October 2026; Annexes A and B revised on 9 October. Annex capacities, supply assumptions and demand-response outputs checked; PLEXOS model not rerun. Annex A rev2. Annex B rev2. Annex D.
- IEA · Gas Reserve Mechanisms and Flexibility Options. Published 2026-09-09. Executive summary, sections on physical reserves and commercial flexibility. Geography, infrastructure, technical limits and incentives constrain reserves; flexible contracts, LNG swaps and cooperation can complement them. Policy analysis, not a delivery guarantee or winter forecast.
This analysis is not investment advice.
// cite this analysis
l0g, “European gas: bridging the gap between cargoes”, l0g.fr, published October 14, 2026, updated October 14, 2026, https://l0g.fr/en/analysis/european-gas-bridging-gap-between-cargoes/
$ cd ../analysis