// analysis
El Niño: when the backup depends on the same rain
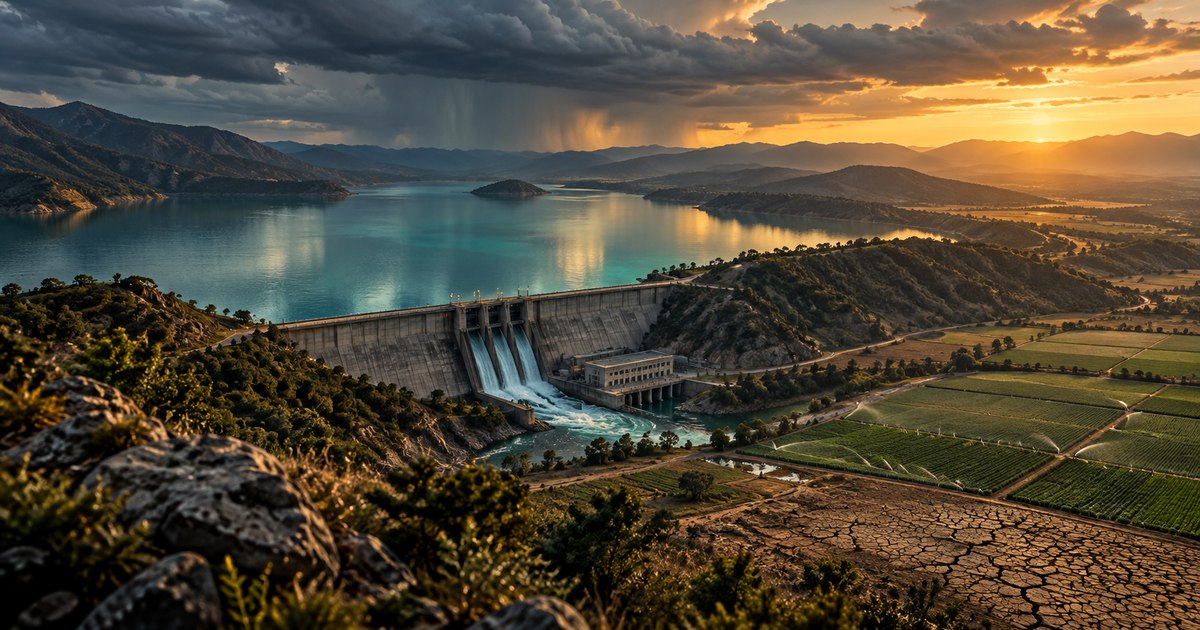
Crops, reservoirs and foreign currency: the 2026 episode puts shared dependencies to the test, despite still-abundant global cereal supply.
On 2 October 2026, the FAO was still forecasting the world’s second-largest cereal harvest on record. Six days later, the World Meteorological Organization said El Niño was expected to strengthen further, with a peak around December. There is room for both assessments. The grain already harvested remains available, while crops still growing and reservoirs supplying the coming months depend on rainfall that has yet to arrive. [1] [2]
The macroeconomic risk emerges when several sources of protection become vulnerable together. A farm needs rain. So does the reservoir supplying electricity to its pumps. A neighbouring country that would normally provide extra power may face the same shortfall. Imports then become the fallback for several sectors at once. An economy’s exposure lies partly in these shared dependencies, which a sector-by-sector assessment can overlook.
Zambia’s experience in 2024 provides a documented example. Assessing the current episode requires a fresh look at forecasts, crop seasons and available reserves. The public evidence points to very uneven exposure. It also provides substantial grounds for resisting the idea of an inevitable global food shortage. This investigation follows the transmission from ocean conditions to agriculture and electricity, then into trade, currencies and prices. [12]
A shift in the Pacific moves the rain
Under ordinary conditions, equatorial trade winds push surface water from the Americas towards Asia. Warm water builds up in the western Pacific, where rising moist air helps clouds and rainfall develop. In the east, the upwelling of colder water helps keep the surface cooler. During El Niño, weaker trade winds allow warm water to extend further into the central and eastern Pacific. Atmospheric convection shifts with it. Convection is the upward movement of warm, moist air that helps generate rain. [6]
This is a coupled ocean–atmosphere process. Sea temperatures help measure it, while winds and rainfall reveal how it is developing. In its 8 October assessment, NOAA already observed enhanced rainfall over the central and eastern Pacific and suppressed activity around Indonesia. Changes in atmospheric circulation can then affect weather far beyond the ocean region where the disturbance begins. Climate scientists call these distant relationships teleconnections. [3]
Reading the diagram
Conceptual equatorial cross-section, west on the left and east on the right, without a geographic or temperature scale. The thermocline schematically separates warmer surface water from colder deep water. Arrows show the dominant movements relevant to the explanation. Sources: NOAA JetStream and the 8 October 2026 diagnostic discussion.
Other conditions still matter. WMO’s October–December outlook favours wetter conditions in south-eastern South America and drier conditions in the north-west. It also identifies the contribution of other ocean basins. National borders do not mark the boundaries of air masses or river catchments. A producer’s exposure depends on the location of its land and water resources within these larger systems. [18] [2]
Australia shows why the local forecast is essential. On 1 October, the Bureau of Meteorology projected wetter conditions across much of the western half of the country and parts of the east, but a drier outlook for parts of the far north and south-east. A blanket assumption that El Niño means drought everywhere in Australia would discard information that matters for both crops and reservoirs. The global signal, the regional forecast and subsequent observations need to be read together. [7]
The probability has a specific meaning
NOAA assigns an 83% probability to a three-month average RONI of at least +2.5°C during October–December 2026. Its corresponding probabilities are 54% for September–November and 70% for November–January. These are overlapping windows describing the possible strength of the same episode. They are not independent events, and their probabilities cannot be added. [3]
RONI, introduced for US operational monitoring from February 2026, adjusts the regional Pacific signal for warming shared across the tropics. That distinction helps separate the contrast relevant to atmospheric circulation from the more general warming of the ocean. ECMWF explains why traditional and relative indices can yield different assessments of El Niño strength in a warmer world. [4] [5]
Definition and data
September–November 2026: 54%. October–December 2026: 83%. November 2026–January 2027: 70%. A single forecast vintage. The values describe neither three independent events nor national drought probabilities. RONI means Relative Oceanic Niño Index. NOAA’s next diagnostic discussion is scheduled for 12 November 2026.
WMO’s release uses a different presentation: an expected seasonal Niño 3.4 temperature anomaly of approximately +3.7°C for October–December, alongside a chart using a 1993–2009 reference period. This describes a particular ocean region relative to a specified baseline. NOAA’s relative threshold follows another construction. Joining the figures into one series would manufacture a change that partly reflects measurement choices. Neither figure measures global warming above pre-industrial levels. [2] [4] [5]
A convincing ocean forecast still leaves several steps between the climate signal and economic damage. Where will rainfall fall short? For how long? How much moisture and stored water will be available when it does? The economic questions follow: which crops will be at sensitive stages, what generation can replace missing hydropower, and which trading routes will remain usable? Each link needs its own evidence. The climate index tells analysts where to investigate; it does not supply a national GDP forecast.
Crops have critical windows
Annual rainfall is an incomplete measure of a farmer’s exposure. Rain arriving after a critical growth stage may fail to recover the yield already lost. Moist soil at the beginning of a dry spell can, in contrast, provide temporary protection. The interaction between crop development, timing and initial water reserves helps explain why fields under the same regional climate signal can experience different outcomes. GEOGLAM, the international crop-monitoring initiative, highlighted drought during crop development in its 2024 southern African alerts. [9]
Harvested area and yield must also be separated. Output can decline because fewer hectares are planted, because each hectare produces less, or through a combination of the two. In its 2 October 2026 assessment, the FAO describes a reduced and poorly distributed Indian monsoon that restricted some plantings and tightened irrigation supplies for off-season production in southern states. Water shortages can carry forward from one agricultural season into the next. [1]
Regional offsets become important at the global level. October’s bulletin from the Agricultural Market Information System (AMIS) describes rice yields as historically tending to fall below trend during El Niño, while soybean yields have often been above trend. The geographic concentration of each crop helps explain the difference. The same episode can weaken one source of food or feed while supporting another. That variation is a real source of resilience in global supply. [8]
Scope of the ranges
AMIS Market Monitor No. 142, October 2026, p. 2. Unit: percentage deviation of each crop’s global yield from trend. The bulletin describes wheat as near normal to slightly below normal and maize as broadly in line with trend; no invented numerical values are plotted for them. Crops have different areas, uses and calendars. Their percentages cannot be added.
Additional soybeans cannot immediately replace rice in a population’s diet. Substitution depends on uses, processing equipment, eating habits and markets. Some adjustments are easier in animal feed than in human food. The FAO already reports changes in projected maize use being offset by barley, sorghum and wheat in feed rations. Supply has buffers, but their reach has to be assessed product by product. [1]
High global production can therefore coexist with local scarcity. Equally, a severe drought in a prominent producing country may be offset elsewhere. Following the 2026–2027 risk requires attention to planting and yield revisions, sensitive growth periods and supplies that can actually be exported. A collection of dramatic photographs would tell the reader little about those mechanisms.
The timing also affects interpretation. A crop that has already been harvested carries a different exposure from one about to be planted. A forecast peak in the ocean around December cannot be mapped onto every country’s annual production figure. The relevant unit of analysis is the crop season in the affected region, with its own starting conditions and opportunities for adjustment. This is why aggregate harvest estimates can remain strong even as the risks facing later crops increase.
A reservoir remembers earlier seasons
Hydropower adds a different clock. A reservoir stores part of earlier inflows and allows operators to choose when to release it. That flexibility can absorb a period of poor rainfall until reserves or operating constraints become binding. Its position depends on initial storage, catchment inflows, withdrawals and water already released. Two dams experiencing the same dry quarter may have very different room to manoeuvre.
Electricity generation depends on the flow through the turbines and the available head, meaning the useful difference in water elevation. Lower inflows can restrict the volume available for generation. A falling reservoir can also reduce the head. Installed capacity describes what the equipment can deliver under appropriate conditions; the energy available over a season depends on water that can actually be used. The US Department of Energy sets out this relationship between flow, head and output. [10]
Physical assumptions
The diagram shows crops, a reservoir, an intake, a turbine and the return of water downstream. Water passing through a turbine continues along the river: hydropower generation is not equated with water consumption. Irrigation and neighbouring-grid links represent possible dependencies that must be verified for each system. Zambia’s 2024 experience documents constrained regional electricity imports.
Irrigation can protect a crop when rain fails to arrive directly over the field. It introduces other dependencies: an available water source, access to it and, in some systems, power for pumping. Drawing from a strained reservoir may constrain other uses. The assessment needs to follow the water to the field and, where relevant, the electricity that makes the withdrawal possible. The presence of irrigation equipment alone says little about a farm’s ability to withstand a prolonged regional drought.
A detail in the IMF’s Zambia paper makes the distinction unusually clear. Its figure on the potential benefits of irrigation assumes no limitation on water and explicitly excludes actual irrigation-water availability. That is a way to isolate an agricultural potential. Turning the result into an operational source of resilience requires identifying the water and a way to move it. A modelling assumption can be useful without proving that the corresponding adaptation is physically available. [12]
Zambia’s neighbours faced the same drought
On 1 May 2024, NASA published a comparison of the Kafue Flats in April 2023 and April 2024. Water and vegetation had receded. Its account reported that central and southern parts of Zambia received half or less of their usual rainfall between late January and mid-March. The drought was affecting soils, the river and water resources used by agriculture and electricity generation together. These are 2024 observations, despite the later update date displayed on the NASA page. [11]
An IMF assessment completed in June 2025 and published in the Selected Issues series that September describes a power system then relying on hydropower for approximately 80% of electricity generation. During the 2023–2024 crisis, load shedding reached up to twenty hours a day in urban centres such as Lusaka. Crucially, drought in neighbouring countries constrained electricity imports. Cross-border connections provided a route for exchange, but producers on both sides shared weather exposure. [12]
That detail changes the assessment of backup capacity. An interconnector can reduce vulnerability to a local outage when the other system has spare power. A regional drought can erode the spare capacity of several systems at once. The line remains physically available; electricity at its far end becomes harder to obtain. A credible backup assessment therefore examines the supplier’s resources during the very scenario in which its customer is likely to need them.
The domestic allocation of electricity also matters. The IMF reports that ZESCO prioritised mines and large manufacturers in 2024, leaving smaller businesses more exposed. It would be misleading to infer an automatic, proportionate collapse in copper exports from the severity of household outages. Protecting selected sectors can preserve foreign-currency earnings while concentrating disruption elsewhere. An aggregate output statistic only partly captures that distribution. [12]
Attributing the weather requires a separate line of evidence. World Weather Attribution examined the December 2023–February 2024 deficit in a region covering Zimbabwe, Botswana and southern parts of Zambia and Mozambique. It identified a significant El Niño contribution; human-induced warming did not emerge as a significant driver of the assessed drought. That finding applies to the region, period and variables studied. It keeps the attribution of this particular event distinct from the broader effects of climate change. [13]
Our investigation of the wet megawatt examines the connections between European power plants, catchments and water constraints. The comparison concerns these physical dependencies; Zambia’s experience retains its own context.
Zambia provides an observed transmission mechanism, including important limits to a simple account of the damage. Applying it to 2026–2027 would require updated reservoir levels, inflows, generating resources and neighbouring supply conditions. The historical evidence establishes that several fallbacks can fail together. It does not quantify the probability that the same outcome will occur again this season.
Rice stocks and access to import supplies
October’s agricultural estimates are a substantial counterweight to a narrative of generalised food shortage. The FAO expects 2,979 million tonnes of cereals in 2026, 2.1% below the 2025 record but still an exceptionally large harvest. A risk assessment has to recognise that buffer before examining its weaknesses. It then needs to distinguish the kinds of reserves included in the global total and where they are held. [1]
Rice offers a useful example. The October FAO-AMIS table forecasts 216.9 million tonnes of world stocks at the end of the 2026–2027 marketing seasons, on a milled basis. The corresponding figure excluding China is 112.4 million tonnes. Subtracting gives 104.5 million tonnes for China, or 48.2% of the total, rounded to one decimal place. This calculation locates stocks. It does not measure supplies available to foreign buyers. [8]
Calculation, period and limitations
FAO-AMIS table dated 2 October 2026: world 216.9 Mt; world excluding China 112.4 Mt. China = 216.9 − 112.4 = 104.5 Mt. Share = 104.5 / 216.9 × 100 = 48.1789%, rounded to 48.2%. Stocks aggregate the ends of national marketing seasons; this is not a simultaneous physical warehouse census on 11 October. The breakdown does not specify ownership, commercial commitments or export availability.
Reserves may supply domestic consumption, cover existing commitments or depend on a public decision to release them. For an importer, useful supply is something it can buy, move and receive in time. The amount physically present in the world is one element of that chain. China’s share alone is not evidence that its stocks are unavailable; it demonstrates why a global total requires further investigation.
The FAO’s wheat discussion provides a particularly revealing example. It raises expected stocks in Russia and Ukraine because export expectations have been reduced. The same bulletin describes Black Sea shipping constraints and insufficient alternative routes as reasons for a weaker trade outlook. Higher stocks in producing countries can therefore accompany lower accessibility for buyers. This particular constraint is logistical, but it can coincide with weather-related import needs elsewhere. [1]
Cargo routes and input supplies are examined in Wheat between Hormuz and the Bosphorus. These logistical constraints can affect access to grain even when global totals remain high.
Trade policy adds another potential link. A World Bank analysis published in June describes how export restrictions can aggravate conditions when several food-market risks coincide. Protecting domestic supply changes the volumes available abroad. If several suppliers take similar decisions, an importing country can lose part of the diversification it thought it had. This remains a channel to monitor: the investigation does not establish a worldwide wave of new export bans caused by the current El Niño. [15]
Import needs can rise as earnings weaken
Consider an economy that imports fuel and experiences a common water shortage affecting some of its crops and hydropower. This is a transmission scenario, without a country label or a fabricated estimate. A poor harvest can increase food purchases from abroad. Available thermal generation may replace part of the missing electricity, but require more fuel. Dependence on rainfall is then partly exchanged for dependence on external supply.
Activity can weaken at the same time. Farms have less to sell, workshops interrupt production and some exporters earn less. Foreign-currency pressure can consequently come from two directions: additional needs and reduced inflows. Its extent depends on the structure of the economy, which sectors are protected and which revenue streams keep operating. Zambia’s prioritisation of mining shows why this part of the chain needs careful country-level evidence. [12]
Reading the links
Arrows indicate possible effects to be assessed country by country. Thermal substitution requires usable capacity and fuel. Depreciation depends on the exchange-rate regime, capital flows, reserves and other receipts. Weaker demand can offset part of the pressure on inflation. No numerical GDP, currency or price effect is estimated.
Usable reserves, external financing and receipts from other sectors can absorb the difference. When these prove inadequate, adjustment may occur through the exchange rate, lower imports or administrative restrictions, depending on the regime. Under depreciation, an imported product with an unchanged dollar price costs more in local currency. Households can face an additional squeeze beyond the original agricultural shortfall.
Indirect effects are central to research by Cashin, Mohaddes and Raissi published by the IMF in 2015. Their framework links twenty-one countries or regions using data from the second quarter of 1979 to the first quarter of 2013. It examines transmission through trading partners alongside direct exposure and finds heterogeneous responses. The framework explains why a country may be affected without experiencing drought itself. The historical results would need updating before supporting any numerical forecast for 2026. [16]
For a European buyer, the chain may begin with a supplier’s power supply, continue through its production and financing constraints, and eventually affect deliveries. A bank’s borrowers in different industries may depend on the same local water system. An insurer may face claims arriving close together in time. These are exposures to investigate, not losses established by the current evidence. Diversification across counterparties needs to be checked against diversification of the resources those counterparties actually use.
A further caution concerns aggregation. Reduced farm output, lower sales by a processor and lost orders at a transport company can describe successive effects of the same disruption. They cannot simply be added into a national loss estimate without accounting for intermediate transactions, substitutions and value added. The purpose of tracing the chain is to identify where constraints spread and where they are absorbed. It is not to multiply the original shock by the number of organisations it touches.
Inflation also encounters weaker demand
Higher food or electricity prices leave households with less purchasing power for other goods and services. Businesses may postpone expenditure or cut production. That weakening in demand can restrain other prices. In remarks delivered on 5 May 2026, the ECB highlighted this ambiguity in the medium-term inflation outcome: weather shocks can raise some food prices while depressing output, income and demand. [17]
An initial change in relative prices and persistently broader inflation therefore require different assessments. Relevant observations include transmission to other products, expectations, exchange rates and the duration of the disruption. Central banks influence financing conditions and demand. An interest-rate decision cannot replenish a reservoir, but it can affect the economic propagation of the shortage. The trade-off becomes more difficult when activity is already weakening.
International food-price data need equally careful interpretation. The FAO index measures a particular basket of internationally traded commodities. Household prices also reflect transport, exchange rates, taxes, local stocks and distribution. Its 2 October release discusses weather concerns alongside logistical disruption. Assigning every observed movement to El Niño would erase those other drivers and obscure which responses might help. [14]
Three observations should remain separate: the amount produced, the ability to deliver it and the price eventually paid in each currency. They can move in different directions. A well-supplied world market may remain difficult to access for particular buyers. Conversely, lower production can meet sufficient reserves and substitution to contain the price response.
Test the backup under the same shock
The decisive question for the coming months is whether alternatives remain available precisely when they are called upon. A full reservoir at the start of the season provides a different margin from one already depleted. Suppliers in less closely correlated catchments can reduce common exposure. Other generating technologies can widen the choices, provided usable capacity, grid access and necessary inputs are in place. Resilience is a property to test under a scenario, beyond counting facilities or contracts.
The hypothesis of compounding damage would weaken if rain returned before critical crop stages, reservoirs recovered or production gains elsewhere became accessible to affected buyers. Available power in neighbouring systems and continued access to import finance would also improve the picture. Those observations could justify reducing the economic risk assessment even while the ocean episode remained powerful.
The concerning sequence would combine deteriorating crop estimates, weak water inflows and shrinking regional backup margins. Falling exportable supplies or tighter access to foreign currency would add further constraints. Each element needs to be established before claiming that the sequence is occurring in a particular economy. Global bulletins can guide the investigation; local operating and market data determine the result.
As of 11 October 2026, the evidence remains mixed: a high probability of an intense ocean episode, heterogeneous local outlooks and substantial global cereal supplies. The FAO schedules its next update for 6 November and NOAA its next diagnostic discussion for 12 November. In the meantime, water inflows and crop development will alter the risk before it appears in revised macroeconomic forecasts. [1] [3] [7]
Zambia’s experience suggests the right question: will the fallback remain available when the usual source fails? For the current episode, the evidence warrants examining shared dependence carefully. The scale of the consequences remains open. The gap between reserves on paper and resources that can be mobilised during the shock is where the macroeconomic investigation needs to continue.
Sources and method
Documentary research closed on 11 October 2026. Climate forecasts issued on 1 and 8 October are kept distinct from agricultural forecasts dated 2 October, observations from 2024 and historical research. The six figures are original compositions based on the cited sources. Ocean, catchment and macroeconomic diagrams are conceptual. No economic probability, damage map or GDP loss has been reconstructed. Rice-stock calculations are explicit and reproducible. Rolling webpages are identified in the source register.
No interviews, grid audits or original hydrological modelling were undertaken. The full WMO report linked through its library was not obtained; the sources used are its public release and summary. The available evidence does not provide a global volume of freely exportable stocks or an economic-crisis probability derived from ENSO probabilities. Historical findings are used to test mechanisms and their limits, without automatic extrapolation to 2026–2027.
- FAO : Cereal Supply and Demand Brief, 2 October 2026. Forecasts of production and stocks, revisions and transport constraints. This monthly page is updated in place. Accessed 11 October 2026.
- WMO / OMM : Sea-surface temperatures reflect strengthening El Niño, 8 October 2026. Release dated 8 October; the footer also shows a 6 October update. The public release was read, not the full library report. Accessed 11 October 2026.
- NOAA / CPC : ENSO Diagnostic Discussion, 8 October 2026. Probabilities of three-month RONI ≥ +2.5°C: 54%, 83%, 70%. Overlapping windows. Next discussion scheduled for 12 November. Rolling page. Accessed 11 October 2026.
- NOAA / CPC : CPC adopts Relative Oceanic Niño Index (RONI), February 2026; day not stated. RONI adjusts the Pacific signal for warming shared across the tropics. Adoption date is distinct from access date. Accessed 11 October 2026.
- ECMWF : Measuring the strength of El Niño, 10 June 2026. Why regional anomalies and relative signals differ in a generally warmer ocean. Accessed 11 October 2026.
- NOAA / JetStream : Effects of ENSO in the Pacific, publication date not stated. Trade winds, warm-water displacement, thermocline and convection. The l0g diagram is a conceptual cross-section, not a geographic scale drawing. Accessed 11 October 2026.
- Australian Bureau of Meteorology : Long-range forecast: October to December 2026, forecast issued 1 October 2026; page published 2 October. Heterogeneous outlook: wetter signal across much of the western half and parts of the east; drier in parts of the far north and south-east. Accessed 11 October 2026.
- AMIS / FAO / GEOGLAM : AMIS Market Monitor No. 142, 2 October 2026. Original report hosted by IFPRI’s Food Security Portal. P. 2: historical yield ranges, not confidence intervals. P. 3: world and ex-China rice stocks. P. 19: definitions and calendars. Pages visually inspected. Accessed 11 October 2026.
- GEOGLAM : Crop Monitor Special Alerts: Southern Africa El Niño Induced Drought, 8 April 2024. Historical alert on drought during crop development; no mechanical extrapolation to 2026/27. Accessed 11 October 2026.
- U.S. Department of Energy : How Hydropower Works, publication date not stated. Flow, head, turbine and generator. Power and reservoir volume are different physical quantities. Accessed 11 October 2026.
- NASA Earth Observatory : Parched Kafue Flats, 1 May 2024. Original publication 1 May 2024, despite a January 2026 page update. Soil, river and reservoir observations; not a 2026 image. Accessed 11 October 2026.
- IMF / Linda Spahia : Zambia: Building Resilience to Climate Shocks, SIP/2025/127, 24 September 2025. Approximately 80% hydropower generation in the 2025 assessment; outages up to 20 hours/day in the crisis described; constrained regional backup; priority for mines. Figure 9 models irrigation with no water limitation. Accessed 11 October 2026.
- World Weather Attribution : El Niño key driver of drought in highly vulnerable Southern African countries, 18 April 2024. Attribution for a defined region and period: a significant El Niño role; climate change did not emerge as a significant driver of the assessed deficit. This does not generalise to all climate risks. Accessed 11 October 2026.
- FAO : FAO Food Price Index rises in September amid weather concerns and transport disruptions, 2 October 2026. The index tracks international food commodity prices, distinct from consumer prices; weather and logistical drivers coexist. Accessed 11 October 2026.
- World Bank / Baffes, Mekonnen, Temaj : When risks stack up: threats to global food markets in 2026, 16 June 2026. Analysis of interacting weather, input, trade and use risks. June forecasts are not used as October numerical baselines. Accessed 11 October 2026.
- IMF / Cashin, Mohaddes, Raissi : Fair Weather or Foul? The Macroeconomic Effects of El Niño, WP/15/89, April 2015. Historical macroeconometric framework, direct and third-market effects, heterogeneous responses. No result is converted into a numerical 2026 forecast. Accessed 11 October 2026.
- European Central Bank : Climate, nature and monetary policy, 5 May 2026. Mechanism combining supply-driven price pressure and weaker demand. The net medium-term inflation effect remains ambiguous. Accessed 11 October 2026.
- WMO / OMM : Global Seasonal Climate Update: October–December 2026, 8 October 2026. Public seasonal outlook summary, to be checked against national services. The full library report was not obtained. Accessed 11 October 2026.
This analysis is not investment advice.
// cite this analysis
l0g, “El Niño: when the backup depends on the same rain”, l0g.fr, published October 11, 2026, updated October 11, 2026, https://l0g.fr/en/analysis/el-nino-backup-same-rain/
$ cd ../analysis