// analysis
US Productivity Q2 Revised: Real Pay Still Lags
The BLS Q2 2026 revision keeps productivity at a 1.4% annual rate as real hourly compensation falls 3.3%, unit labour costs rise 1.2% and labour's share hits 52.8%.
The September 3 revision leaves the Q2 2026 productivity gain unchanged. It makes the loss of purchasing power in hourly compensation slightly steeper: a 3.3% annual rate, against 3.1% in the preliminary estimate. Output per hour and real compensation remain distinct measures.
The Bureau of Labor Statistics (BLS) estimates that labour productivity in the nonfarm business sector rose at a 1.4% annual rate in Q2. Output rose 1.7% and hours worked 0.3%, all unchanged at the published precision. Nominal hourly compensation increased 2.6%, while real hourly compensation fell at a 3.3% annual rate after inflation, using the consumer-price index applied by the BLS. Over four quarters, real hourly compensation was still down 0.1%. BLS, September 3, 2026
This is neither proof that all households are becoming poorer nor a measurement of AI’s effect. It is a narrower signal: more output per hour does not automatically raise real labour income. The BLS also reports labour’s share of output at 52.8%, the lowest level in a series beginning in 1947.
From preliminary to revised
| Nonfarm business sector, Q2 2026 | Preliminary, August 6 | Revised, September 3 | Revision |
|---|---|---|---|
| Productivity | 1.4% | 1.4% | 0.0 pp |
| Output | 1.7% | 1.7% | 0.0 pp |
| Hours worked | 0.3% | 0.3% | 0.0 pp |
| Nominal hourly compensation | 2.7% | 2.6% | -0.1 pp |
| Real hourly compensation | -3.1% | -3.3% | -0.2 pp |
| Unit labour costs | 1.3% | 1.2% | -0.1 pp |
| Labour share of output | 52.9% | 52.8% | -0.1 pp |
The first six rows are annualised quarterly changes. The last is a level. The revision therefore affects compensation and labour costs, not the volume of output per hour. The two BLS releases document the move from the August 6 preliminary estimate to the September 3 revision.
Three figures with different jobs
Productivity here means real output per hour worked in the nonfarm business sector. It is not a measure of one worker’s performance or pay.
Real hourly compensation includes wages and employer-paid benefits, then adjusts them for inflation. It is therefore broader than an hourly wage on a payslip. Its 3.3% Q2 fall is an annualised quarterly rate: it describes the pace observed between Q1 and Q2 as though it continued for a year. It does not mean a worker has already lost 3.3% of purchasing power since March.
Unit labour costs divide hourly compensation by productivity. They rose at a 1.2% rate in Q2 and were up 1.4% over four quarters. For a company, this measure indicates whether labour cost per unit of output is accelerating or slowing. Here, productivity absorbed part of the rise in nominal compensation without turning it into a real gain for workers. BLS
An active economy with a less favourable split for labour
The picture is not of an economy that has stopped. In its second estimate, the Bureau of Economic Analysis (BEA) reports that real US GDP rose at a 1.5% annual rate in Q2. Real final sales to private domestic purchasers, which combine consumption and private fixed investment, rose 4.2%, revised up 0.3 percentage point from the advance estimate. BEA, August 26, 2026
Those figures do not contradict the BLS release. They cover different perimeters. The BEA measures aggregate activity, and its private-demand measure does not tell us how output is divided among wages, profits and taxes. The BLS measures output and costs per hour in nonfarm business. Subtracting one rate from the other to infer a household “loss” would be wrong.
The point of attention lies elsewhere. Output and demand can grow while real compensation stalls or falls. If that divergence persists, consumption becomes more dependent on other supports, including accumulated saving, credit or employment. The BLS and BEA releases cannot identify which support is at work, or establish that households are already under stress. They only show that productivity growth cannot settle the question of disposable income.
The signal has a narrow scope
The word “risk” needs precision. The BLS release does not demonstrate a consumer crisis, let alone a shock caused by AI, tariffs or the White House. It also does not measure the income distribution across household groups.
It does identify three mistakes worth avoiding.
- Treating a productivity gain as a living-standard gain. The first raises output per hour. The second also depends on prices and on how value added is shared.
- Ignoring unit labour costs. Their 1.2% increase in Q2 remains moderate. That can ease pressure on margins and prices without improving real purchasing power.
- Attributing the figure to AI. The BLS does not break productivity down by technology. Our review of AI and productivity evidence explains why one aggregate quarter cannot isolate a causal effect.
This distinction also matters for markets. A company can report stronger margins because productivity improves. At economy level, sustained demand still requires households to have real income or another sustainable way to fund spending. The September 3 release cannot choose between those paths. It does rule out treating them as the same thing.
What the revision leaves open
The September 3 release confirms the 1.4% productivity gain and makes the annualised quarterly decline in real compensation slightly steeper. It does not turn one quarter into a trend. The four-quarter comparison is quieter: productivity +2.2%, real hourly compensation -0.1% and unit labour costs +1.4%. The next quarterly observation will be the preliminary Q3 estimate, scheduled by the BLS for November 5, 2026. BLS
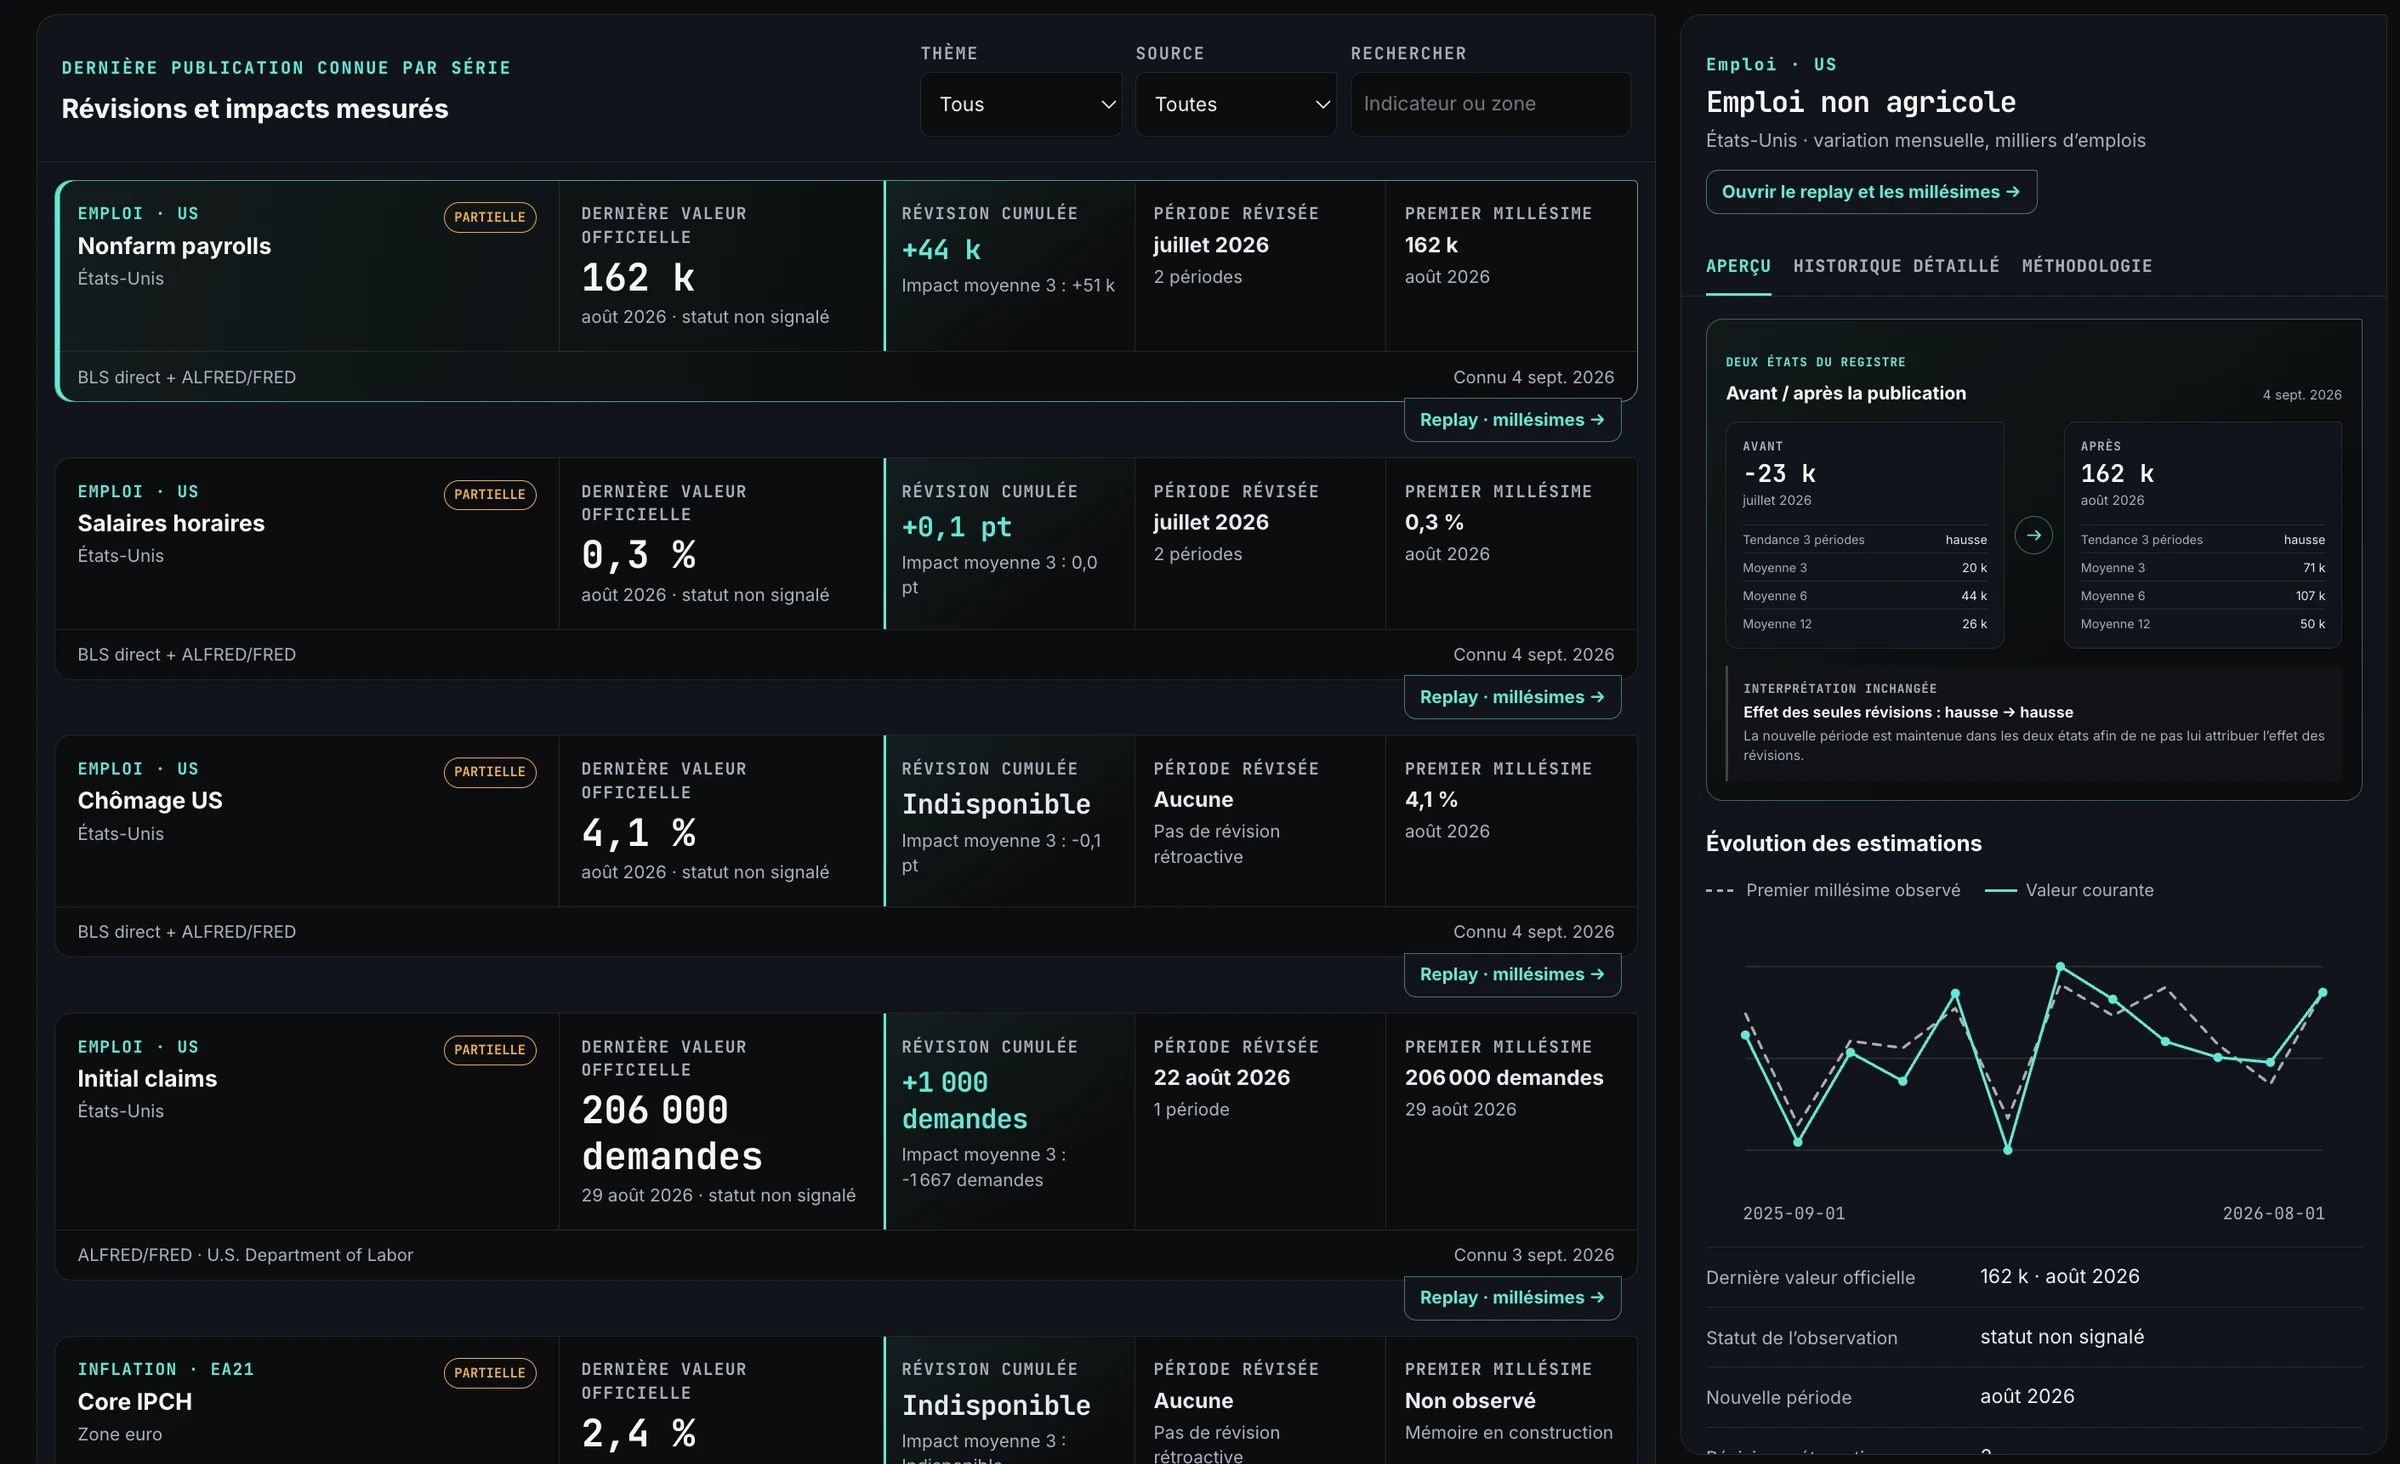
This revision shows why vintages need to be preserved instead of retaining only the most recent value. The l0g Watch revision ledger applies that logic to the BLS employment and inflation series covered on September 5, 2026, keeping the first estimate, most recent official value and revision impact separate.
Sources
- Bureau of Labor Statistics, Productivity and Costs, Second Quarter 2026, Revised, September 3, 2026: productivity, output, hours, nominal and real hourly compensation, unit labour costs, labour share and release calendar.
- Bureau of Labor Statistics, Productivity and Costs, Second Quarter 2026, Preliminary, August 6, 2026: preliminary values used in the revision table.
- Bureau of Economic Analysis, GDP, Second Estimate and Corporate Profits, Second Quarter 2026, August 26, 2026: real GDP, real final sales to private domestic purchasers, gross domestic income and profits.
Limitations
The Q2 figures are revised, but historical BLS series may still change in later updates. Quarterly changes are stated at annual rates, while the four-quarter comparison spans a full year: they should not be read as the same horizon. The BLS deflates real hourly compensation with CPI-U, not the BEA’s PCE price index. Finally, these aggregates cannot attribute the divergence to a technology, a policy, an industry or a household group. This article is not investment advice.
This analysis is not investment advice.
// cite this analysis
l0g, “US Productivity Q2 Revised: Real Pay Still Lags”, l0g.fr, published August 06, 2026, updated September 05, 2026, https://l0g.fr/en/analysis/us-productivity-real-pay-lags/
$ cd ../analysis